|
|
International Journal of Arrhythmia 2013;14(3): 34-39.
|

Introduction
In cases of tachycardia with a broad QRS
complex, it is important to differentiate between
supraventricular tachycardia (SVT) and
ventricular tachycardia (VT). Electrocardiogram
(ECG)-based differential diagnoses include VT
vs. SVT with aberrant conduction, pre-existing
bundle branch block (BBB), intraventricular
conduction disturbances, and pre-excitation.
Several criteria have been described for differentiation
between VT and SVT in the presence
of a wide QRS complex. We report a case of wide
QRS complex tachycardia with left BBB (LBBB) morphology and a retrograde P wave on the surface
ECG.
Case Report
A 78-year-old woman presented to our hospital
with palpitations and chest discomfort. She
had a 6-year history of non-ST segment elevation
myocardial infarction (MI); however, she
had not received treatment. On physical examination,
blood pressure, pulse rate, and respiratory
rate were 94/63 mmHg, 171 bpm, and 18/min, respectively. Echocardiography revealed an
enlarged left ventricle (5.7 cm) and left atrium
(5.0 cm) with preserved left ventricular systolic
function (ejection fraction, 53%). There was
moderate hypokinesia on the inferior wall from
the base to the apex and from the mid-posterolateral
wall to the apex of the posterolateral wall.
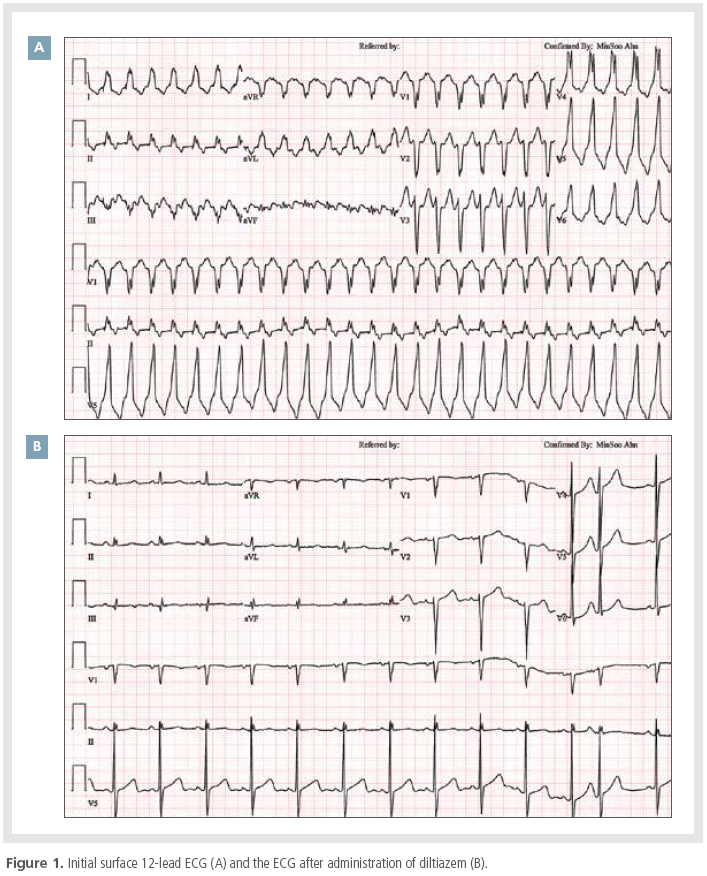
A 12-lead ECG showed wide QRS tachycardia
with LBBB morphology (Figure 1A). The duration
of the QRS complex was 148 ms, and the
axis was normal. RS complexes were observed in
leads V2-3, and R to S intervals in those leads were 72 and 84 ms, respectively. A retrograde
P wave was observed on the terminal portion of
the QRS complex. There was no S wave in lead
V1, and the duration of the S wave in lead V2
was 40 ms. In lead V6, there was only an R wave
with no Q wave. The tachycardia was terminated
by a 10 mg intravenous dose of diltiazem (Figure 1B). Based on the Brugada algorithm, the
ECG findings of this patient strongly suggested a
tachycardia of supraventricular origin.1
After informed consent was obtained, the patient
underwent a cardiac electrophysiological
study. Multipolar electrode catheters were advanced
into the femoral vein and positioned in
the right atrium, His-recording region, right
ventricular apex, and coronary sinus. Retrograde
conduction was existed via the atrioventricular
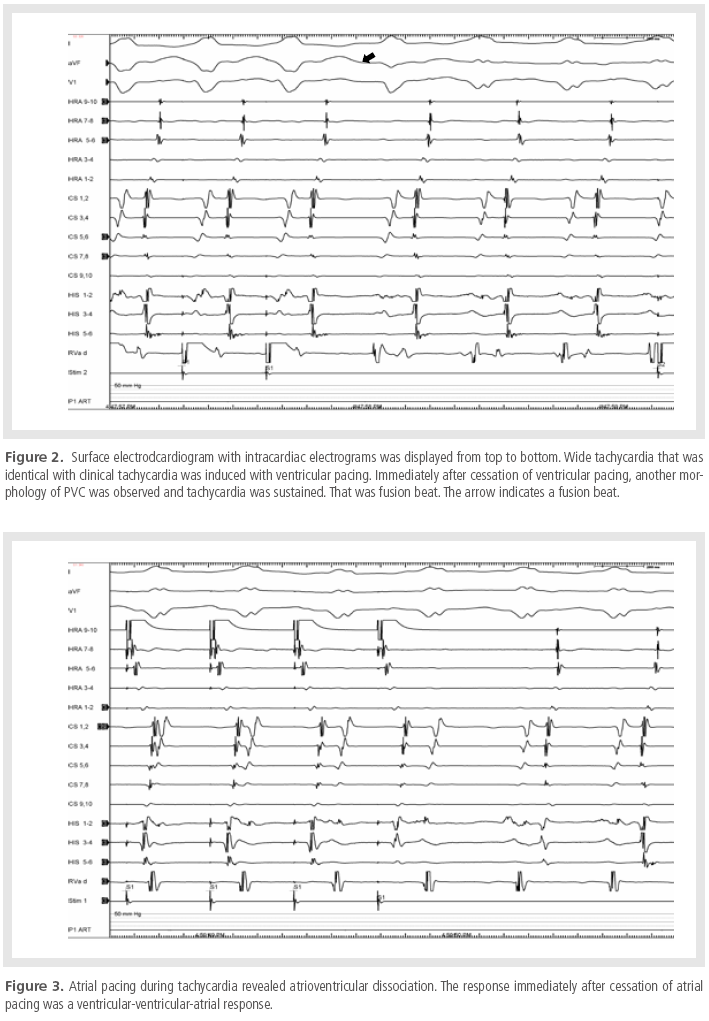
(AV) node. A fusion beat was observed immediately
after cessation of ventricular pacing, and a
sustained tachycardia, which was morphologically
identical to the patient’s clinical tachycardia,
was induced. During tachycardia, the ventricular
electrogram preceded each His potential,
and 1:1 ventriculoatrial conduction was observed
(Figure 2). This tachycardia was entrained with
ventricular pacing at the right ventricular apex,
and the difference between the post-pacing interval
and the tachycardia cycle length was 103 ms. Atrial pacing during tachycardia revealed
AV dissociation and a ventricular-ventricular-atrial response, which was observed immediately
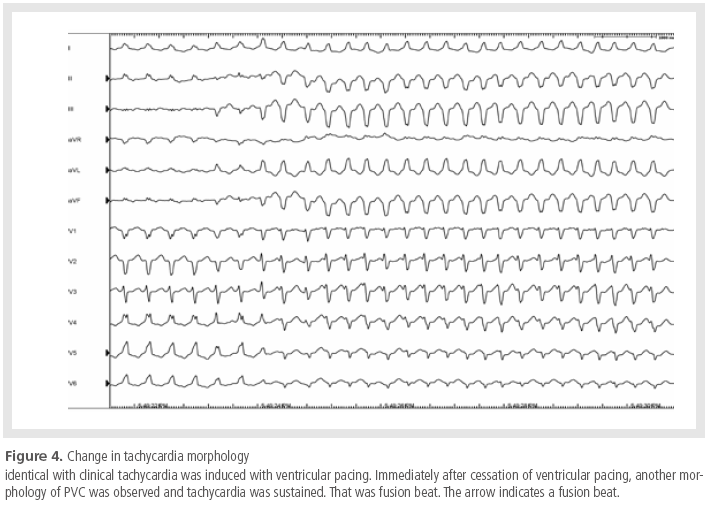
after the last atrial paced complex (Figure 3). The
morphology of the tachycardia was changed, and
the tachycardia was terminated (Figure 4). Because
the tachycardia had been considered supraventricular
in origin before electrophysiologic
study, a 3D mapping system was not prepared,
and the procedure was finished.
Discussion
Wide QRS complex tachycardia still presents a
diagnostic challenge with a 12-lead ECG. ECGbased
differential diagnoses include VT vs. SVT
with aberrant conduction, pre-existing BBB, in-traventricular conduction disturbances, and preexcitation.
VT is the most important differential
diagnosis because of its unfavorable prognosis.
An accurate diagnosis with immediate treatment
is usually required. A delayed diagnosis of
VT or a misdiagnosis followed by inappropriate
intravenous administration of drugs used for the
treatment of SVT, such as verapamil and adenosine,
can cause severe hemodynamic deterioration
and may provoke ventricular fibrillation and
cardiac arrest.
Surface ECG may provide important clues for
the classification of a tachycardia as either SVT
or VT. In 1978, Wellens et al. noted that among
LBBB tachycardias, QR or QS complexes in lead
V6 favored a diagnosis of VT, although all other
QRS morphologies in this lead were nonspecific,
and significant Q waves in V6 occurred infrequently
in patients with VT.2 However, Kindwall
et al. determined that SVT with LBBB exhibited
features of intact right bundle branch conduction,
reflected in a frequent occurrence of
small, narrow (<30 ms) R waves in the anterior
precordial leads (V1 and V2) followed by rapid
and abrupt negative S waves with corresponding
R to nadir of S intervals of <60 ms. In contrast,
an R wave duration >30 ms, notched and
slurred downstrokes to the S waves, and/or R to
nadir of S intervals of >60 ms in leads V1 or V2
favored the diagnosis of VT, as did Q waves in
lead V6.3 Based on a modification of these observations,
Brugada et al. developed an algorithm
for differentiation of wide complex tachycardia.
The absence of an RS complex or an R to nadir
of S interval of >100 ms in any precordial lead
strongly favors VT. If neither of these criteria
are satisfied, the presence of AV dissociation or,
in the case of LBBB morphologies, a notched S
wave in V1 or Q wave in V6 also suggest VT.
Taken in sequence, the algorithm provides a
sensitivity and specificity of 98.7% and 96.5%,
respectively, for the diagnosis of VT. However, in
addition to the ambiguity of diagnosis, it is difficult
to measure precise figures at a paper speed
of 25 mm/s, as the difference between 30 and
40 ms is 0.25 mm. These factors, in combination
with the difficulty in determining the onset
of the initial deflection of the QRS complex, led
to a degree of inter-observer variation in this
study, thereby reducing the objective diagnostic
potential of the technique. In 1991, Griffith et al.
performed a multivariate analysis in 102 patients
to identify which of 15 clinical or 11 ECG variables
are independent predictors of VT. They found
that the following factors assisted diagnosis of
VT: (i) Previous MI is an independent predictor
of VT. (ii) A predominant negative deflection in
lead aVF is suggestive of VT, especially when a
Q wave is present in right BBB (RBBB) pattern
tachycardia. In LBBB pattern tachycardia, a QS
or qR waveform in lead aVF is highly suggestive
of VT, whereas an Rs complex is specific for SVT.
(iii) In RBBB pattern tachycardia, a monophasic
or biphasic waveform in lead V1 suggests VT and
a triphasic RSR, rSR configuration suggests SVT.
(iv) A ≥40° change in axis between sinus rhythm
and tachycardia is an independent predictor of
VT. If none of the above variables are observed,
the diagnosis is almost certainly SVT. If one criterion
is noted, the diagnosis is probably SVT. If
2 criteria were noted, the diagnosis is probably
VT. If 3 or 4 criteria are observed, the diagnosis
is almost certainly VT. The predictive accuracy
of this method was 93%, which increased to 95%
with the inclusion of 2 other criteria: independent
P wave activity and ventricular ectopic beats
during sinus rhythm with the same QRS morphology
as that in tachycardia.4 According to
Griffith's criteria, the history of MI and presence
of a QS wave in lead aVF in our case favors a diagnosis of VT. In 2008, Vereckei et al. presented
a simplified algorithm using only lead aVR; this
algorithm showed high accuracy in the analysis
of 313 patients. The criteria for VT in lead
aVR were as follows: (i) the presence of an initial
R wave, (ii) >40 ms width of an initial R or Q
wave, (iii) notching on the initial downstroke of
a predominantly negative QRS complex, and (iv)
Vi/Vt ≤1.5 In the present case, Vi and Vt were
239 and 400 μV, respectively, resulting in Vi/Vt ≤ 1 and therefore favoring a diagnosis of VT by
Vereckei's criteria.
In conclusion, wide complex tachycardia often
exhibits an indistinct morphology, especially at
higher frequencies, making diagnosis difficult.
Despite all available morphological criteria, wide
complex tachycardias are still misdiagnosed or
can remain undiagnosed. To achieve a high positive
predictive value of >95% in the identification
of VT, a systemic approach that employs a
combination of various ECG and clinical criteria
is needed.
References
- Brugada P, Brugada J, Mont L, Smeets J, Andries EW. A new
approach to the differential diagnosis of a regular tachycardia with
a wide QRS complex
Circulation.
1991;83:1649-1659.
- Wellens HJ, Bar FW, Lie KI. The value of the electrocardiogram in
the differential diagnosis of a tachycardia with a widened QRS
complex.
Am J Med.
1978;64:27-33.
- Kindwall KE, Brown J, Josephson ME. Electrocardiographic criteria
for ventricular tachycardia in wide complex left bundle branch
block morphology tachycardias.
Am J Cardiol.
1988;61:1279-1283.
- Griffith MJ, de Belder MA, Linker NJ, Ward DE, Camm AJ.
Multivariate analysis to simplify the differential diagnosis of
broad complex tachycardia.
Br Heart J.
1991;66:166-174.
- CVereckei A, Duray G, Szenasi G, Altemose GT, Miller JM. New
algorithm using only lead aVR for differential diagnosis of wide
QRS complex tachycardia.
Heart Rhythm.
2008;5:89-98.
|
|
|