


Introduction
Lethal ventricular arrhythmia (LVA), including ventricular tachycardia (VT) and ventricular fibrillation (VF), usually develops within 48 hours of acute myocardial infarction (AMI). Individuals who have AMI and who are either in the acute stage or in the early to late stages of recovery are most vulnerable to sudden death [1,2]. The mechanism responsible for the development of LVA after AMI remains unclear.
Increased transmural dispersion of repolarization (TDR) may create electrophysiological conditions for reentry [3–5]. TDR might be a useful index for predicting ventricular tachyarrhythmia [6–9]. QT prolongation is caused by delayed ventricular repolarization and usually leads to an increase in the degree of temporal dispersion of refractory periods. When complete repolarization has failed, early depolarization after AMI can occur at low membrane potential levels [2,10].
We hypothesized that a relationship may exist among repolarization abnormalities, such as increased TDR, delay of repolarization, and LVA after AMI. The time sequence of electrocardiographic markers predicting LVA after AMI were also evaluated.
Subjects and Methods
We enrolled 97 consecutive patients with AMI, who underwent primary percutaneous coronary intervention. We excluded 25 patients from the study because of electrolyte abnormalities, atrial fibrillation, bundle branch block, pre-excitation syndrome, receiving antiarrhythmic drug or having flat T waves or indefinite end of T waves. Medical records of all patients were reviewed after informed consent was obtained. This study was approved by the Ajou University Hospital Institutional Review Board (approval number: AJIRB-MED-MDB-12–243).
Acute myocardial infarction was defined by the presence of electrocardiographic (ECG) changes associated with typical chest pain and elevated levels of cardiac enzymes. Serial standard 12-lead ECGs were obtained after arrival at the hospital, just before and after primary percutaneous coronary intervention (PCI), and 4, 24, and 48 hours and 5 days after PCI. For accurate measurements, standard 12-lead ECGs were recorded at 50 mm/s paper and a gain of 10 mm/mV. All patients were monitored with continuous ECG recording for the first 48 hours, or longer if necessary. If ventricular arrhythmias were documented on ECG monitoring during the hospital stay, the patients were included in the LVA group. The ventricular arrhythmias included sustained and non-sustained ventricular tachycardia and ventricular fibrillation. The others were included in the non-LVA group. LVA was defined as one of the following: sustained ventricular tachycardia or ventricular fibrillation.
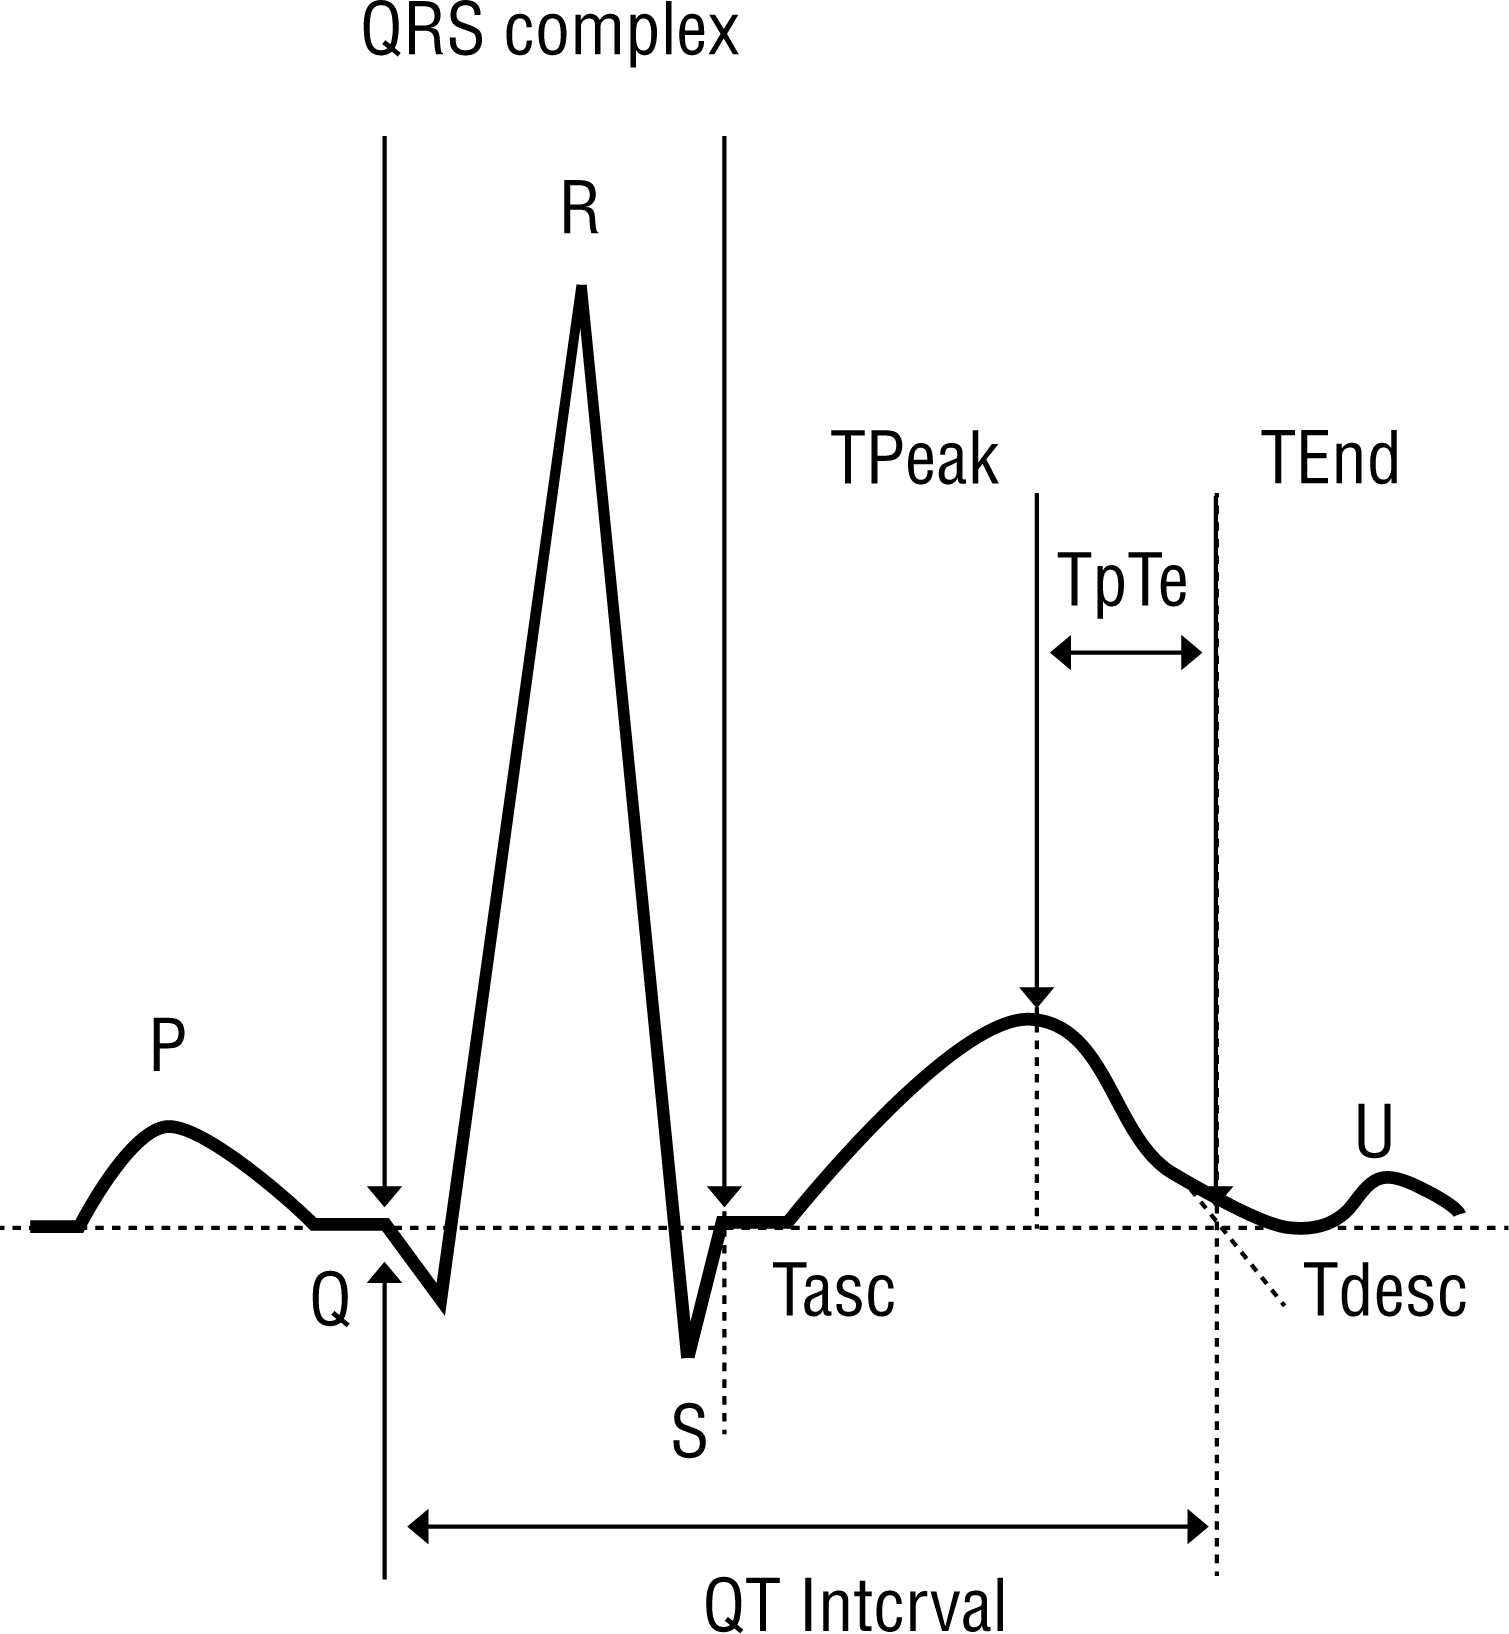
The interval from the peak to the end of the T wave (TpTe), which indicates myocardial TDR [11], and the intervals between onset of QRS and end of the T wave (QTe) on all 12 leads were measured. TpTe was expressed as the absolute value (TpTe), the relative value to the duration of QTe ([TpTe/QTe]x100%), and the corrected value for heart rate (TpTe/√RR). The corrected QT interval (QTc) with Bazett's formula (QT interval/√RR) was also measured (Figure 1) [12].
Figure 1.
Normal electrocardiogram highlighting the common parameters measured when assessing the QT/QTc interval and the interval from the peak to the end of the T wave.
Tasc, ascending portion of the T wave; Tdesc, descending portion of the T wave.
SPSS 12.0 (SPSS inc., Chicago, Illinois, USA) statistical software was used for all calculations. Data are shown as the mean ± standard deviation for continuous variables and as percentages for categorical variables. Analysis of time variance among serial ECGs was measured with repeated measures ANOVA (RMANOVA) and 2-tailed paired Student t-tests. Differences between groups were evaluated with t-tests for continuous variables or chi-square analyses for categorical variables, as appropriate. For the evaluation of inter- and intra-observer variability of TpTe and QT interval, the coefficient of variation and Kendall's tau-b correlation coefficient were calculated. A p value<0.05 was considered statistically significant.
Results
The study population consisted of 72 patients (mean age 55±12 years, 59 male and 13 female). Clinical characteristics are summarized in Table 1. The LVA group consisted of 17 patients (14 male) with a mean age of 55±15 years. The non-LVA group consisted of 55 patients (45 male) with a mean age of 55±11 years. Compared to the non-LVA group, subjects in the LVA group had significantly lower global left ventricular systolic function (ejection fraction 50±7% vs. 56±8%, p=0.025) and more extensive regional wall motion abnormalities (wall motion score index 1.59±0.32 vs. 1.31±0.29, p=0.002).
Table 1.
Baseline characteristics (n=72)
Analyzing with RMANOVA, the TpTe, [TpTe/QTe]x100% and TpTe/√RR after AMI exhibited statistically significant changes in time variance (p=0.002, <0.001 and <0.001, respectively, Table 2). The TpTe significantly shortened from 83±18 ms on admission to 74±14 ms 4 hours after PCI (p=0.006, Figure 2). The [TpTe/QTe] × 100% shortened from 21±5% on admission to 19±3% after PCI (p=0.001, Figure 2). The TpTe/√RR shortened from 87 ± 24 ms on admission to 80±17 ms after PCI (p=0.004, Figure 2). These parameters were not statistically different between the data on admission and just before PCI, or between just after PCI to 48 hours after PCI. TpTe significantly shortened from 79±16 ms 24 hours after PCI to 68±11 ms 5 days after PCI (p<0.001, Figure 2). The [TpTe/QTe] ×100% shortened from 19±2% 48 hours after PCI to 17±2% 5 days after PCI (p=0.013, Figure 2). The TpTe/√RR shortened from 78±14 ms 48 hours after PCI to 71±10 ms 5 days after PCI (p<0.001, Figure 2). Using RMANOVA, the QTc after AMI did not exhibit a statistically significant change with time (p=0.643).
Table 2.
Quantitative change in ECG findings
A, after arrival at the hospital; B, just before percutaneous coronary intervention; C, just after percutaneous coronary intervention; D, 4 hours after percutaneous coronary intervention; E, 24 hours after percutaneous coronary intervention; F, 48 hours after percutaneous coronary intervention; G, 5 days after percutaneous coronary intervention; TpTe, the interval from the peak to the end of the T wave; [TpTe/QTe]×100, the relative value of the interval from the peak to the end of the T wave to the duration of QTe; QTe, the intervals between onset of QRS and end of the T wave; TpTe/√RR, the corrected value of the interval from the peak to the end of the T wave for heart rate; QTc, corrected QT interval
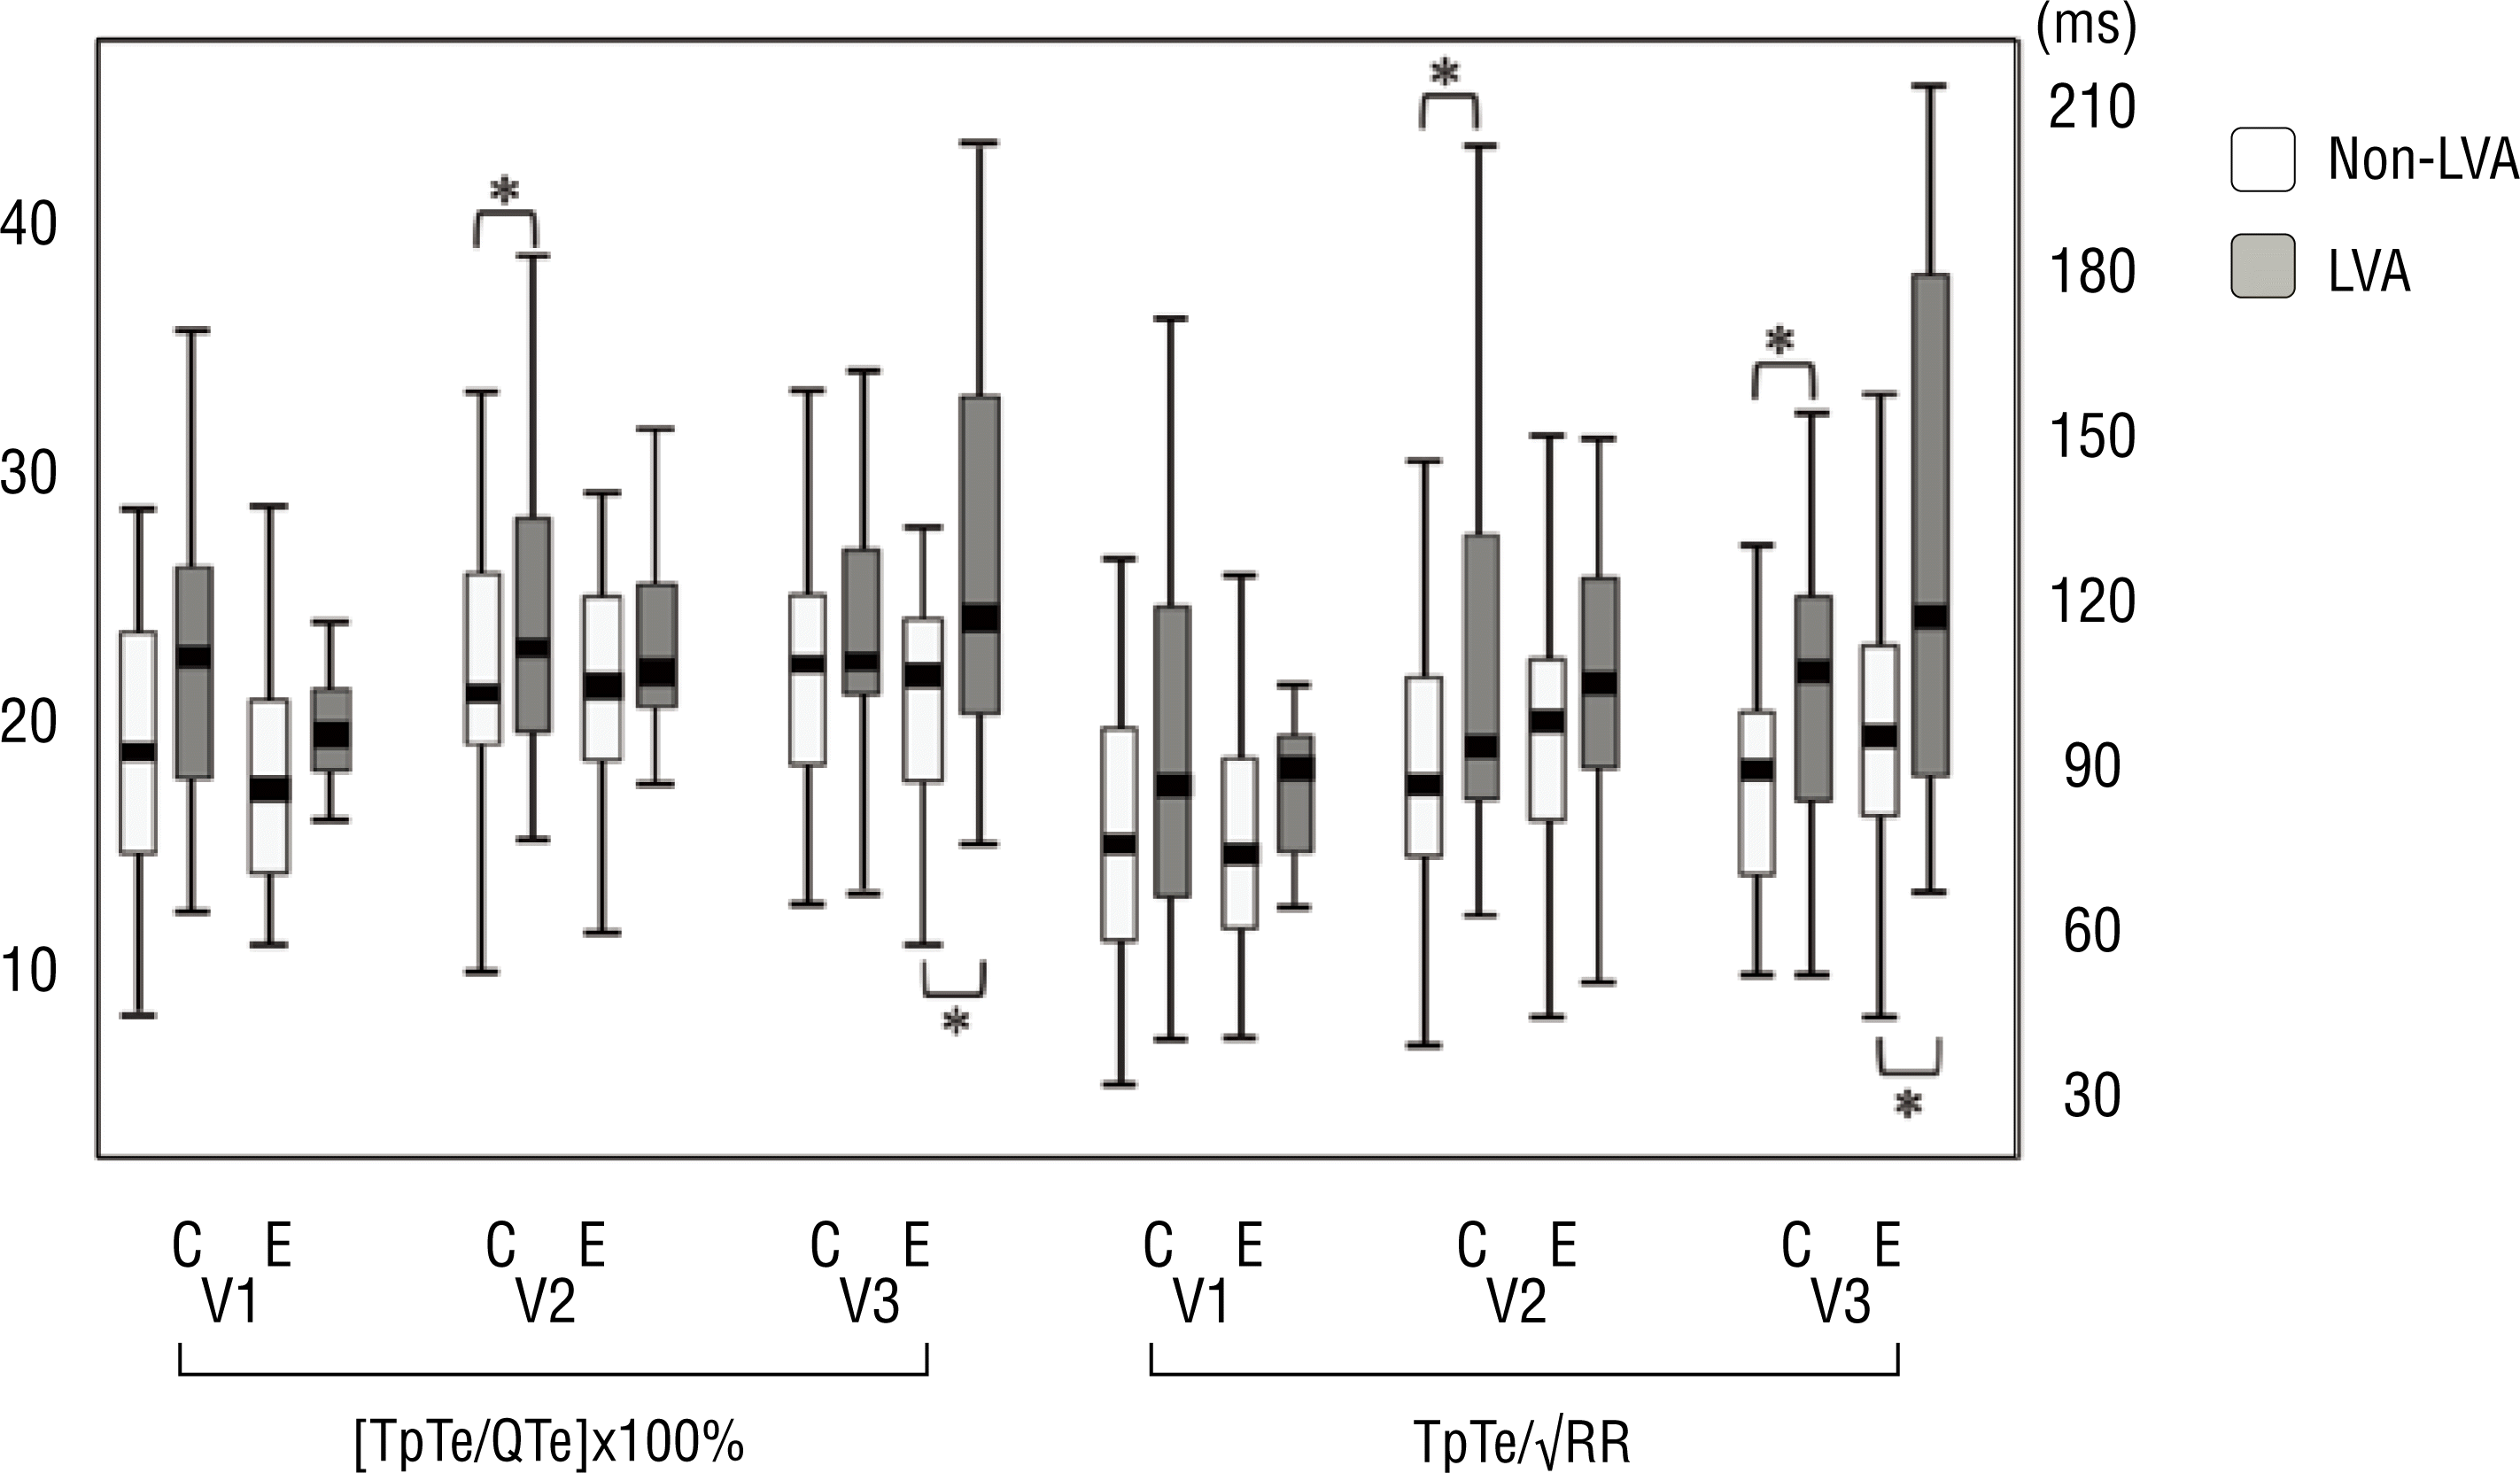
When comparing these parameters in the LVA and non-LVA groups, there was no statistical difference in all the 12 leads of ECG on admission and just before PCI. Just after PCI, the [TpTe/QTe]×100% in lead V2 was significantly higher in the LVA group than in the non-LVA group (25±7% vs. 22±5%, p=0.036, Figure 3). The TpTe/√RR in leads V2 and V3 were significantly prolonged in the LVA group, as compared to the non-LVA group, just after PCI (V2: 109±42 ms vs. 88±22 ms, P=0.05, V3: 108±39 ms vs. 91±27 ms, p=0.048, Figure 3). The [TpTe/QTe]x100% in lead V3 was significantly higher in the LVA group than in the non-LVA group, 24 hours after PCI (28±9% vs. 22±5%, p=0.025, Figure 3). The TpTe/√RR in lead V3 was significantly prolonged in the LVA group, as compared to the non-LVA group, 24 hours after PCI (129±53 ms vs. 99±41 ms, p=0.05, Figure 3). The other parameters showed no statistically significant difference between the two groups. Although the means of all 12 leads for TpTe, [TpTe/QTe]×100%, TpTe/√RR and QTc had a tendency to be prolonged in the LVA group, no statistical significance was detected.
Figure 2.
Time course of the interval from the peak to the end of the T wave (TpTe), the relative value of the interval from the peak to the end of the T wave to the duration of the intervals between onset of QRS and the end of the T wave ([TpTe/QTe]x100 %), and the corrected value of the interval from the peak to the end of the T wave for heart rate (TpTe/√RR).
A, after arrival at the hospital; B, just before percutaneous coronary intervention; C, just after percutaneous coronary intervention; D, 4 hours after percutaneous coronary intervention; E, 24 hours after percutaneous coronary intervention; F, 48 hours after percutaneous coronary intervention; G, 5 days after percutaneous coronary intervention; *, statistical significance

Figure 3.
The relative value of the interval from the peak to the end of the T wave to the duration of the intervals between the onset of QRS and end of the T wave ([TpTe/QTe]x100 %) and the corrected value of the interval from the peak to the end of the T wave for heart rate (TpTe/√RR) according to the lethal ventricular arrhythmia, just after percutaneous coronary intervention (PCI) and 24 hours after PCI.
C, just after percutaneous coronary intervention; E, 24 hours after percutaneous coronary intervention; LVA, lethal ventricular arrhythmia group; non-LVA, non-lethal ventricular arrhythmia group; *, statistical significance.
For the evaluation of inter- and intra-observer variability of TpTe and QT interval, ECGs of 10 patients from 72 patients were randomly selected. The coefficients of variation were 1.46 and 3.45 for inter- and intra-observer variability of QT interval. Coefficients of variation were 3.944 and 3.16 for inter- and intraobserver variability of TpTe, respectively. The Kendall's tau-b correlation coefficient was 0.79 (p=0.007) and 0.778 (p=0.008) for inter- and intra-observer variability of TpTe, respectively, indicating good reproducibility and feasibility. Kendall's tau-b correlation coefficient was 0.964 (p<0.001) and 0.956 (p<0.001) for inter- and intra-observer variability of QT interval, respectively.
Discussion
The present study demonstrated that repolarization abnormalities, such as increased TDR and delay of repolarization, existed in patients with AMI. TDR was significantly increased in patients with LVA. With time, these parameters, which indicate repolarization abnormalities, exhibited significant change, particularly after PCI.
TDR was represented by the interval between the peak and end of the T wave [10]. The increase in TDR was reported to be associated with phase 2 reentry and dispersion of reploarization, which led to reentry-mediated LVA [3–5,13]. Several clinical studies demonstrated that increased TDR was associated with LVA [6–9]. The present study demonstrated that increased TDR existed in patients with AMI, and was particularly associated with LVA. Regardless of LVA, the patients with AMI tended to exhibit increased TDR before revascularization. These results suggested that the increased TDR may be one of the mechanisms responsible for the development of LVA after AMI and the interval between the peak and end of the T wave might be a valuable method of arrhythmia risk stratification in patients with AMI. Following revascularization, the TDR showed a significant decrease with time. The revascularization may have an important role in reducing the LVA after AMI. Several studies also demonstrated that the revascularization of ischemic myocardium decreases the arrythmogenic potential by reducing myocardial TDR [14–16]. In the present study, although the increased TDR gradually decreased after PCI, the significant decrease in the TDR was observed at least 24 hours after PCI. The risk of LVA after AMI may be stabilized at least 24 hours after PCI. Therefore, intensive ECG monitoring may be required for patients with AMI within at least 24 hours after PCI.
In the present study, the increased TDR in the V2 and V3 leads was closely associated with LVA. Although the means of TDR in all 12 leads tended to be increased in the LVA group compared to the non-LVA group, no statistical significance was detected. The TDR may be best measured in the precordial leads, since V2, V3 and V4 leads are in closest proximity to the ventricular myocardium and may be expected to provide the most accurate approximation of TDR and the most accurate transmural information [8].
QTc prolongation after MI often leads to early after-depolarizations and triggered arrhythmias [17,18]. However, several clinical studies failed to demonstrate the correlation between the QTc interval and LVA after AMI [19–21]. Varriale et al. reported that LVA occurred irrespective of the underlying QTc interval in their study population and the prognosis of LVA was not correlated with the QTc interval, but with correct and prompt treatment [19]. Gadaleta et al. failed to demonstrate the correlation between the QTc interval and LVA after AMI and concluded that the QTc prolongation after MI may be one of the predictors of risk for ischemia, and not for arrhythmia [21]. In the present study, we also failed to demonstrate the correlation between the QTc interval and LVA after AMI. The mechanisms responsible for the development of LVA after AMI may be more closely associated with TDR than with QTc interval.
There are several limitations to the present study. First, the present study was based on a small sample size; therefore, time variance of TDR according to the presence of LVA or culprit lesion could not be measured. Further studies may be required to investigate these points. Second, the study population was highly selective for those who survived AMI. In the present study, the non-survivors, regardless of LVA, were excluded. Third, all parameters were manually measured, since the accuracy of automatic measurements was questionable in many cases [22]. For more accurate measurements, standard 12-lead ECGs were traced at 50 mm/s paper and a gain of 10 mm/mV.
Conclusion
The mechanisms responsible for the development of LVA after AMI may be associated with transmural reentry. Revascularization may have an important role in reducing LVA after AMI. The risk of LVA after AMI may decrease at least 24 hours after PCI. Intensive ECG monitoring may be required for patients with AMI within at least 24 hours after PCI.


