|
|
International Journal of Arrhythmia 2015;16(1): 11-18.
|


Introduction
Ventricular fibrillation (VF) initiates as a well-organized waves
consisting of one or two functionally re-entrant rotating waves
(rotors). This stage, classically defined as Wiggers stage 1 VF,
degenerates within seconds, into a more complex, less organized
activation pattern classically defined as Wiggers stage 2 VF.1 This
process is thought to involve wavebreaks, wherein wavefronts are
split into two or more pieces by a conduction block.
Wavebreaks can occur when wavefronts collide with an
obstacle, which can be either anatomic or functional, but the
occurrence of such events depends on tissue excitability, obstacle
size, and wavefront curvature.2 Previous studies showed that heart
wavebreaks seem to occur when wavefronts encounter zones of
refractoriness created by the passage of the previous activation.2,3
The restitution hypothesis predicts that a small perturbation in
action potential duration (APD) can result in larger APD changes
on a beat-to-beat basis (i.e., alternans), which would increase the
vulnerability to unidirectional conduction block and
wavebreaks.4,5 Furthermore, alternans can be spatially discordant,
when the phase of alternation is out of phase with different
regions of the heart, and tend to increase the dispersion of
refractoriness and the propensity to conduction blocks.6
While intracellular calcium (Cai) cycling is also increasingly
recognized as an important regulator of dynamic wave instability,
Cai dynamics may also contribute independently to initiation and
break of reentry;7,8 however, its role in wavebreak occurrence is still
unclear.
In this study, we aimed to classify the patterns of wavebreak
using dual optical mapping techniques to study membrane
potential (Vm) and Cai during the application of T-wave shocks,
as well as to examine the role of Cai dynamics.
To exclude the possibility that the wavebreak occurred
somewhere beneath the tissue surface, we studied 10 hearts in
which endocardial cryoablation left only a thin (0.5-mm) layer of
surviving epicardial tissue.
Materials & Methods
Surgical Preparation and Cryoablation
New Zealand white rabbits (N=10) weighing 3-5 kg were used
in this study. After general anesthesia, the rabbit hearts were
rapidly excised through midline sternotomy and immersed in cold
Tyrode’s solution (NaCl 125, KCl 4.5, NaH2PO4 1.8, NaHCO3
24, CaCl2 1.8, MgCl2 0.5, dextrose 5.5, and albumin 100 mg/L in
deionized water). The ascending aorta was immediately
cannulated and perfused with warm oxygenated Tyrode’s solution
(36.5°C ± 0.5°C, pH 7.4 ± 0.5) at a rate of 30-40 mL/min to
maintain a perfusion pressure between 80 and 95 mmHg. Two
widely spaced bipolar electrodes were used for continuous
pseudo-electrocardiography monitoring. Endocardial
cryoablation was performed by placing a 7-cm SurgiFrost® probe
(CryoCath Technologies Inc., Montreal) into the left ventricle
(LV). The probe temperature was decreased to -135°C for 5-10
minutes, during which, the epicardium was protected by the
addition of warm (37°C) oxygenated Tyrode’s solution, while the
entire heart was continuously Langendorff-perfused. Bipolar
electrodes for S1 pacing were attached to the LV apex. Right
ventricular (RV) endocardial (cathode) and LV patch electrode
(anode) were placed for direct current (DC) shocks. After the
optical mapping study, we perfused the coronary arteries with 1%
triphenyl tetrazolium chloride (TTC) and sectioned the heart
horizontally into five equally spaced sections to document the
effects of cryoablation.
Optical Mapping
We used 0.5 mg of Rhod-2 AM (Molecular Probes) dissolved
in 1 mL of dimethylsulfoxide containing Pluronic F-127 (20%
wt/vol) to stain Cai. This solution was diluted in 300 mL of
Tyrode’s solution to achieve a final Rhod-2 AM concentration of
1.48 μmol/L, and was infused into the heart over a 10-min period.
After perfusion with dye-free Tyrode's solution for 15-30 min to
achieve Rhod-2 AM de-esterification, the heart was then stained
again by direct injection of a voltage sensitive dye (RH237,
Molecular Probes) into the perfusion system. The double-stained
heart was excited with a laser light at 532 nm. Fluorescence was
collected using two charge-coupled device (CCD) cameras
(Dalsa) covering the same mapped field. The CCD cameras for
Vm and Cai, were fitted with 715-nm long-pass and 580 ± 20 nm
band-pass filters, respectively. The digital images (128 × 128 pixels) were gathered from the epicardium of the LV (25 x 25 mm2
area), resulting in a spatial resolution of 0.2 x 0.2 mm2 per pixel.
We acquired 1,000 frames continuously with a 12-bit resolution
(260-400 frames/second, or roughly 2.5-4 ms per frame). The
voltage sensitive dye RH237 was used because its emission
bandpass differs from that of Rhod-2, thereby preventing crosstalk
between the two signals. The signal-to-noise ratio of our mapping
system, as estimated from the peak-to-peak time variation in
fluorescence intensity, is 40 to 1 during pacing and about 5 to 1
during VF. Cytochalasin D (cyto-D, 5-10 μmol/L) was added to
the perfusate to minimize motion artifacts.
As two CCD cameras were used, the same anatomical location
may appear at different coordinates on the Vm and Cai maps.
Therefore, we implanted four cactus needles on the epicardium as registration markers. A software program then used these markers
to match the pixels on the Vm and Cai maps to the same locations.
Data analyses were performed only with aligned maps.
Dual Optical Mapping of VT to VF Transition
After 8 S1 paced beats, biphasic truncated exponential
waveform shocks (117 ± 62 V) of fixed pulse duration (6 ms)
were delivered with a S1-shock coupling interval of 142 ± 25 ms
from a Ventritex HVS-02 defibrillator on the T wave with dual
optical mapping, and data recorded during the induction of VF.
Data Analysis
The activation maps were used to examine Vm and Cai patterns
during the induction of VF. The average fluorescence level (F) of
the entire data window was calculated first, and the fluorescent
level of each pixel was then compared with this average. We
assigned shades of red to represent above-average fluorescence and
shades of blue to represent below-average fluorescence to generate
the ratio maps. All data are presented as means ± SD.
Results
Patterns of Wavebreak
A total of 145 episodes of new wavebreaks occurred from within the mapped region 1122 ± 647 ms, resulting in VT to VF
transition, with large and spatially heterogeneous variations of Vm
and Cai occurring shortly after the shock-induced VT. In 135 of
145 episodes (93%), the wavebreaks occurred when a wavefront
visited an area with persistent Cai elevation. The Vm map at that
site showed partial or full repolarization. Figure 1 shows a typical
example of a wavebreak in a high Cai area. Figure 1A shows Vm
and Cai maps at the time of the shock (0 ms) and three additional
snapshots 4 ms apart. In this and other color panels, the right and
left lower corners were outside of the heart and were cropped. The
bright dot observed at 0 ms is a light artifact used to indicate the
time of the shock, after which, the Cai map showed high Cai and
low Cai areas marked with a white and yellow asterisk,
respectively, in the 236-ms frame. In the Vm map, the wavefronts
propagated only from the corresponding low Cai area (yellow asterisk in the 240-ms frame) and formed a wavebreak (white
arrow in the 244-ms frame). The black arrow shown in the phase
map (Figure 1B) indicates a phase singularity formed at the
boundary between the high and low Cai area, 244 ms after the
shock. Phase singularities are points surrounded by all phases of
activation that occur at the intersection of wavefronts and
wavebacks, formed by wavebreak events.7 Figure 1C shows a
ventricular myocardium after successful endocardial cryoablation.
While the surviving epicardium shows a brick red color after
staining with a 1% TTC solution, TTC-negative tissues show cell
necrosis and contraction bands, compatible with effective
cryoablation.
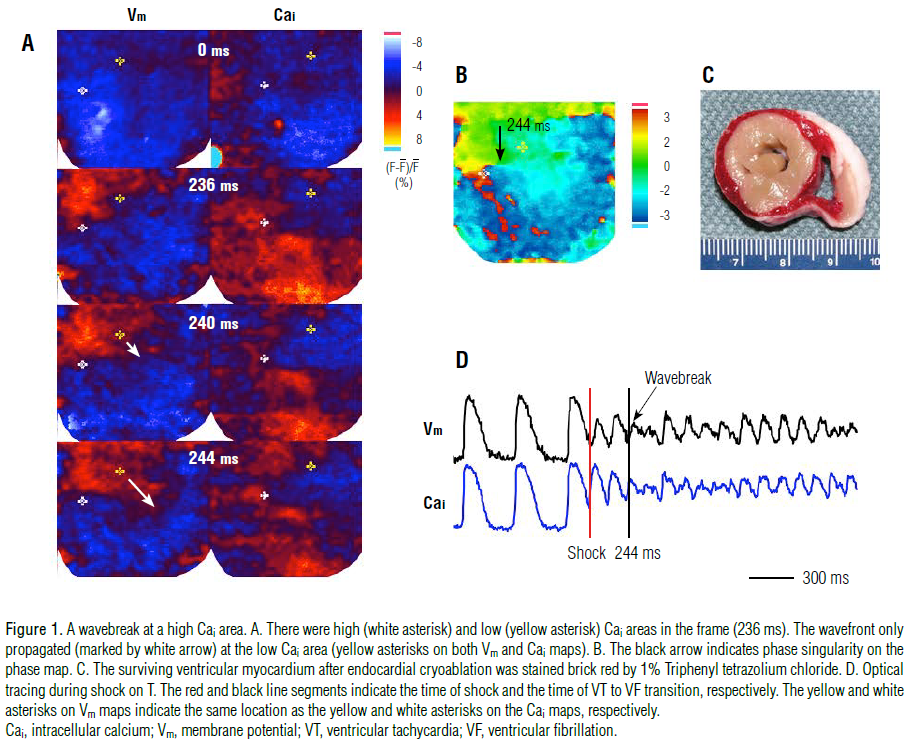
Figure 1D shows optical signals of Vm and Cai. Red and black
line segments indicate the time of shock, and VT to VF transition,
respectively. In 103 of the 135 episodes, the region of persistent
Cai elevation appeared to surround part of a Cai sinkhole (a low
Cai area surrounded by a high Cai area) which hindered wavefront
propagation, and led to the occurrence of the wavebreak in the Cai
sinkhole.
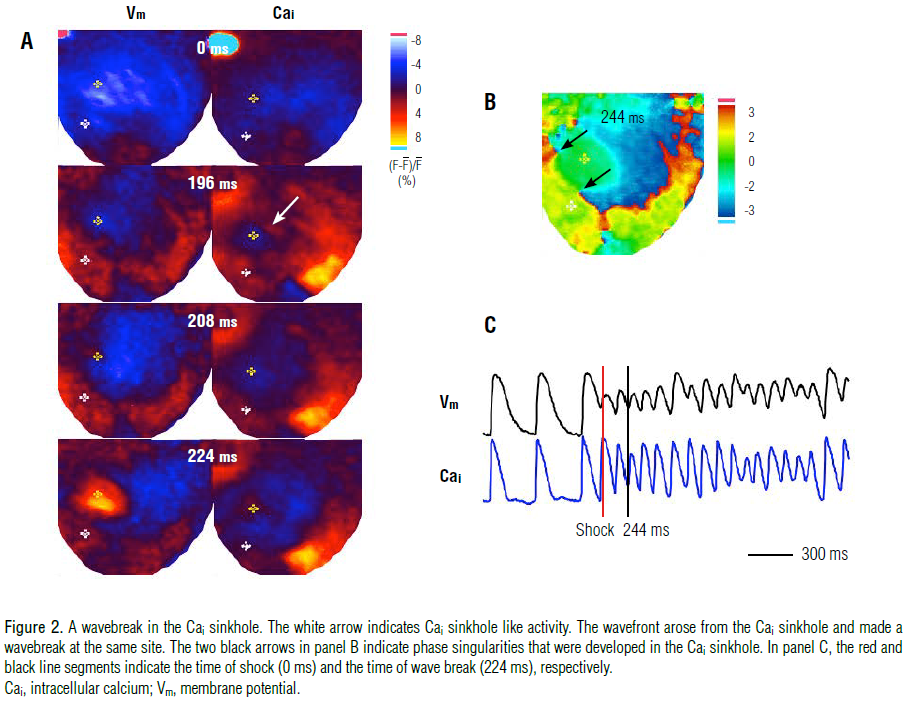
Figure 2 shows a typical pattern of a wavebreak in the Cai sinkhole that occurred 196 ms after the T-wave shock, shown
by the white arrow on panel A. An electrical activation, marked by
the yellow asterisk on the Vm Map in the 208-ms frame, arose
from the corresponding Cai sinkhole site. The wavefront
propagated (224 ms frame in panel A) and the wavebreak
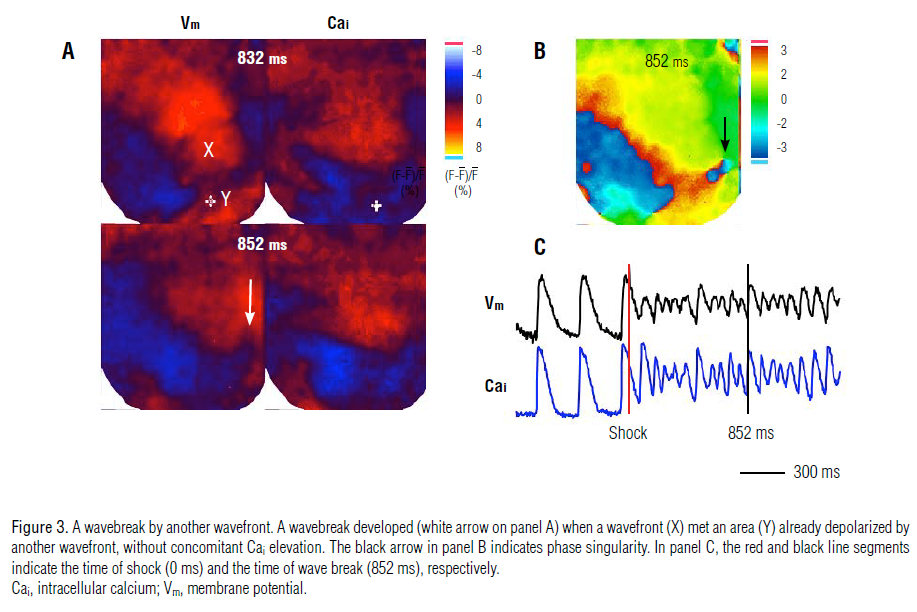
occurred (black arrows in panel B). However, in 4 episodes (3%), a
wavebreak occurred when a wavefront encountered an area
already depolarized by another wavefront, without concomitant
Cai elevation. This is illustrated in Figure 3A by the lack of Cai
activation observed on the Cai map at the corresponding site of
the Y wavefront (marked by asterisk in the 832-ms frame) when
the X and Y wavefronts met. Nonetheless, the wavebreak then
developed at the edge of the X wavefront (white and black arrows
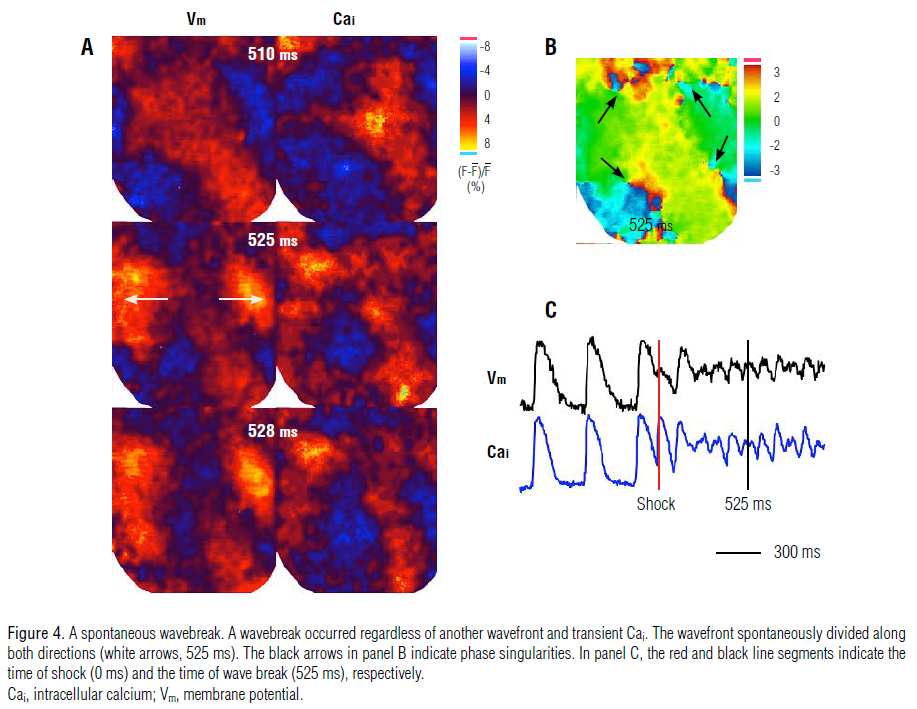
in the 852-ms frame shown in Figure 3A and 3B). In addition, 6
(4%) wavebreak episodes developed spontaneously regardless of
the presence of another wavefront and Cai dynamics. Figure 4
shows an example of a spontaneous wavebreak, in which the
wavefront (frame 510 ms) spontaneously split to both sides (525 ms frame), resulting in a wavebreak (528-ms frame, Panel B).
Discussion
Wiggers first proposed four distinct phases of VF based on
epicardial motion visualized by high-speed cinematography in
canine hearts. The 4 stages are as follows: (1) initial tachysystolic
stage (0-1 s of VF), (2) stage of convulsive incoordination (1-40 s
of VF), (3) stage of tremulous incoordination (40 s-3 min of VF),
and (4) stage of progressive atonic incoordination (>3 min of
VF).1 The wavebreak (VT to VF transition) may occur during
stage 2. The present study showed that the formation of
wavebreaks at high Cai areas is the most common phenomenon
associated with the VT to VF transition and the continuation of
VF after a T-wave shock. These findings indicate that Cai
dynamics play an important role in the VT to VF transition.
Mechanisms of Wavebreak Generation
Tissue heterogeneity, resulting from electrical and structural
remodeling, has been considered a key factor promoting
wavebreaks. Recent evidence indicates that dynamic factors such
as cellular membrane voltage and Cai cycling operate
synergistically with tissue heterogeneity to promote wavebreaks.
Normally, when a wave propagates through tissue, the wavefront
and waveback never touch, but when they do, their point of
intersection defines a wavebreak. This point is sometimes called a
phase singularity,7 around which all phases of activation-recovery
(action potential) converge.9
Moreover, wavebreaks may also occur at anatomic source-sink
mismatches,7 such as pectinate10 and papillary muscle insertions,11 or at the anterior right ventricular insertion site;12 they may also
occur when electrical excitability is depressed regionally due to
ischemia or drugs. However, a rotor induced by rapid pacing or a
premature stimulus, may spontaneously break up into a
fibrillation-like state despite homogeneous initial conditions.
Furthermore, dynamic factors may also induce fibrillation in
the normal heart.13,14 For instance, as the wavelength is the product
of APD and conduction velocity (CV), a steep APD restitution
slope ( >1)13,15 or a broad CV restitution can drive a wavebreak.16
An alternative possible explanation for the VT to VF transition
is also provided by Keldermann et al., who reported that a
mechanoelectrical feedback via stretch-activated channels could
induce the deterioration of an otherwise stable spiral wave into
turbulent wave patterns similar to that of VF.17
Calcium Dynamics and Wavebreak
The role of Cai cycling as a key factor in dynamic wave
instability is well recognized, and increasing evidence suggests
that, under normal physiological conditions, regulation of the
contractile force of the beating heart by Cai is tightly controlled by
Vm, such that the Cai transient is effectively slaved to the AP.
However, calcium-induced calcium release can exhibit
independent dynamics.7 For instance, Cai transients induce
alternans and highly complex periodicities, despite the fact that
the Vm waveform is fixed,18 and Cai alternans is also the
predominant cause of APD alternans19 and promoter of
wavebreaks.
Moreover, Cai dynamics plays an important role in the
mechanism of ventricular vulnerability and defibrillation. In fact,
we previously showed that the first postshock activation always
occurs from a Cai sinkhole after unsuccessful and type B successful
defibrillation shocks.8 In this study, most wavebreaks originated
around the high Cai area of the Cai sinkhole, as this region of
persistent Cai elevation hindered wavefront propagation,
generating the typical wavebreak pattern seen in Figure 2.
Therefore, the results from this study add to the accumulating
evidence suggesting that Cai dynamics plays an important role in
VT to VF transition and defibrillation.
Study Limitations
This study has a number of limitations. As with all current
optical mapping studies, deeper layers of myocardium could not
be examined for other possible preferential wavebreaks locations.
Although, this is the reason why we performed experiments using
cryoablated ventricles, the myocardial ischemia caused by
subendocardial cryoablation could have affected the results of this
study. It is possible that 10 wavebreak episodes were the result of
subepicardial wavebreaks, regardless of Cai dynamics, because
wavebreaks that occurred in the subepicardium could not be
detected by the epicardial mapping techniques used. In addition,
all experiments were performed with rabbit hearts (New Zealand
white rabbits), and mechanisms underlying wavebreaks may differ
in different species, as well as in ischemic and failing hearts.
Conclusion
Wavebreaks occurring in high Cai areas appears to be the most
common phenomenon associated with VT to VF transition and
continuing VF after a T-wave shock. These findings indicate that
Cai dynamics play an important role in the mechanisms of VT to
VF transition.
References
- Wiggers CJ. Studies of ventricular fibrillation caused by electric shock: cinematographic and electrocardiographic observations of the natural process in the dog’s heart: its inhibition by potassium and the revival of coordinated beats by calcium.
Am Heart J.
1930;5:351-365.
- Lee MH, Qu Z, Fishbein GA, Lamp ST, Chang EH, Ohara T, Voroshilovsky O, Kil JR, Hamzei AR, Wang NC, Lin SF, Weiss JN, Garfinkel A, Karagueuzian HS, Chen PS. Patterns of wave break during ventricular fibrillation in isolated swine right ventricle.
Am J Physiol Heart Circ Physiol.
2001;281:H253-H265.
- Choi BR, Jang W, Salama G. Spatially discordant voltage alternans cause wavebreaks in ventricular fibrillation.
Heart Rhythm.
2007;4:1057-1068.
- Karma A. Electrical alternans and spiral wave breakup in cardiac tissue.
Chaos.
1994;4:461-472.
- Garfinkel A, Chen PS, Walter DO, Karagueuzian HS, Kogan B, Evans SJ, Karpoukhin M, Hwang C, Uchida T, Gotoh M, Nwasokwa O, Sager P, Weiss JN. Quasiperiodicity and chaos in cardiac fibrillation.
J Clin Invest.
1997;99:305-314.
- Watanabe MA, Fenton FH, Evans SJ, Hastings HM, Karma A. Mechanisms for discordant alternans.
J Cardiovasc Electrophysiol.
2001;12:196-206.
- Weiss JN, Qu Z, Chen PS, Lin SF, Karagueuzian HS; Hayashi H, Garfinkel A, Karma A. The Dynamics of Cardiac Fibrillation.
Circulation.
2005;112:1232-1240.
- Hwang GS; Hayashi H; Tang L, Ogawa M, Hernandez H; Tan AY, Li H, Karagueuzian HS, Weiss JN, Lin SF, Chen PS. Intracellular Calcium and Vulnerability to Fibrillation and Defibrillation in Langendorff-Perfused Rabbit Ventricles.
Circulation.
2006;114:2595-2603.
- Hideki Hayashi, MD, PhD, Shien-Fong Lin, PhD, Peng-Sheng Chen, MD. Preshock phase singularity and the outcome of ventricular defibrillation.
Heart Rhythm.
2007;4:927-934.
- Wu TJ, Yashima M, Xie F, Athill CA, Kim YH, Fishbein MC, Qu Z, Garfinkel A, Weiss JN, Karagueuzian HS, Chen PS. Role of pectinate muscle bundles in the generation and maintenance of intra-atrial reentry: potential implications for the mechanism of conversion between atrial fibrillation and atrial flutter.
Circ Res.
1998;83:448-462.
- Kim YH, Xie F, Yashima M, Wu TJ, Valderrabano M, Lee MH, Ohara T, Voroshilovsky O, Doshi RN, Fishbein MC, Qu Z, Garfinkel A, Weiss JN, Karagueuzian HS, Chen PS. Role of papillary muscle in the generation and maintenance of reentry during ventricular tachycardia and fibrillation in isolated swine right ventricle.
Circulation.
1999;100:1450-1459.
- Bourgeois EB, Reeves HD, Walcott GP, Rogers JM. Panoramic optical mapping shows wavebreak at a consistent anatomical site at the onset of ventricular fibrillation.
Cardiovasc Res.
2012;93:272-279.
- Karma A. Electrical alternans and spiral wave breakup in cardiac tissue.
Chaos.
1994;4:461-472.
- Qu Z, Kil J, Xie F, Garfinkel A, Weiss JN. Scroll wave dynamics in a three-dimensional cardiac tissue model: roles of restitution, thickness, and fiber rotation.
Biophys J.
2000;78:2761-2775.
- Chen, P. S., H. S. Karagueuzian, J. N. Weiss, and A. Garfinkel. Spirals, chaos, and new mechanisms of wave propagation.
Pacing Clin Electrophysiol.
1997;20:414-421.
- Wu TJ, Lin SF, Weiss JN, Ting CT, Chen PS. Two types of ventricular fibrillation in isolated rabbit hearts: importance of excitability and action potential duration restitution.
Circulation.
2002;106:1859-1866.
- Keldermann R. H., Nash M. P., Gelderblom H., Wang V. Y., Panfilov A. V. Electromechanical wavebreak in a model of the human left ventricle.
Am J Physiol Heart Circ Physiol.
2010;299:H134-H143.
- Chudin E, Goldhaber J, Garfinkel A, Weiss J, Kogan B. Intracellular Ca dynamics and the stability of ventricular tachycardia.
Biophys J.
1999;77:2930-2941.
- Walker ML, Wan X, Kirsch GE, Rosenbaum DS. Hysteresis effect implicates calcium cycling as a mechanism of repolarization alternans.
Circulation.
2003;108:2704-2709.
|
|
|
|