International Journal of Arrhythmia 2013;14(4): 40-45.
Untitled Document
ECG & EP CASES
Visualization of Critical Isthmus by Delayed Potential Mapping
Yong-Seog Oh, MD, PhD Cardiovascular Center, Seoul St. Mary’s Hospital, Catholic University of Korea
Introduction
Many patients with structural heart disease have
hemodynamically unstable ventricular tachycardia
(VT). If hemodynamically stable, mapping can be
performed. Conventional stable VT mapping consists
of voltage mapping for defining scar,1 electrogram
mapping for characterizing the slow conduction
zone, and entrainment/pace mapping for isthmus
mapping. Mapping systems recreate the geometry of
the ventricles using point-by-point sampling.
Here, we present activation mapping guided by
delayed potentials, which facilitate simultaneous
visualization of a slow conduction zone and isthmus/
exit mapping.
Case Report
A 57-year-old man presented to our institution
with frequent implantable cardioverter-defibrillator
(ICD) shock. He had undergone an ICD implantation
12 months previously for the treatment of syncope
with non-ischemic cardiomyopathy (ejection fraction,
19%). We performed an electrophysiological
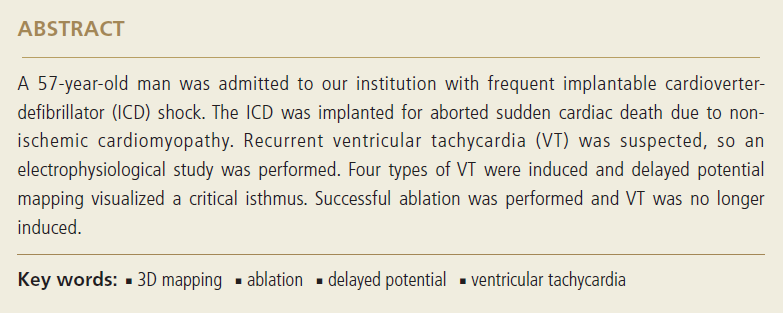
study. Four types of VT were induced (Figure 1) using
a magnetic navigation system (Noibe®). During
the ongoing VT, the patient was hemodynamically
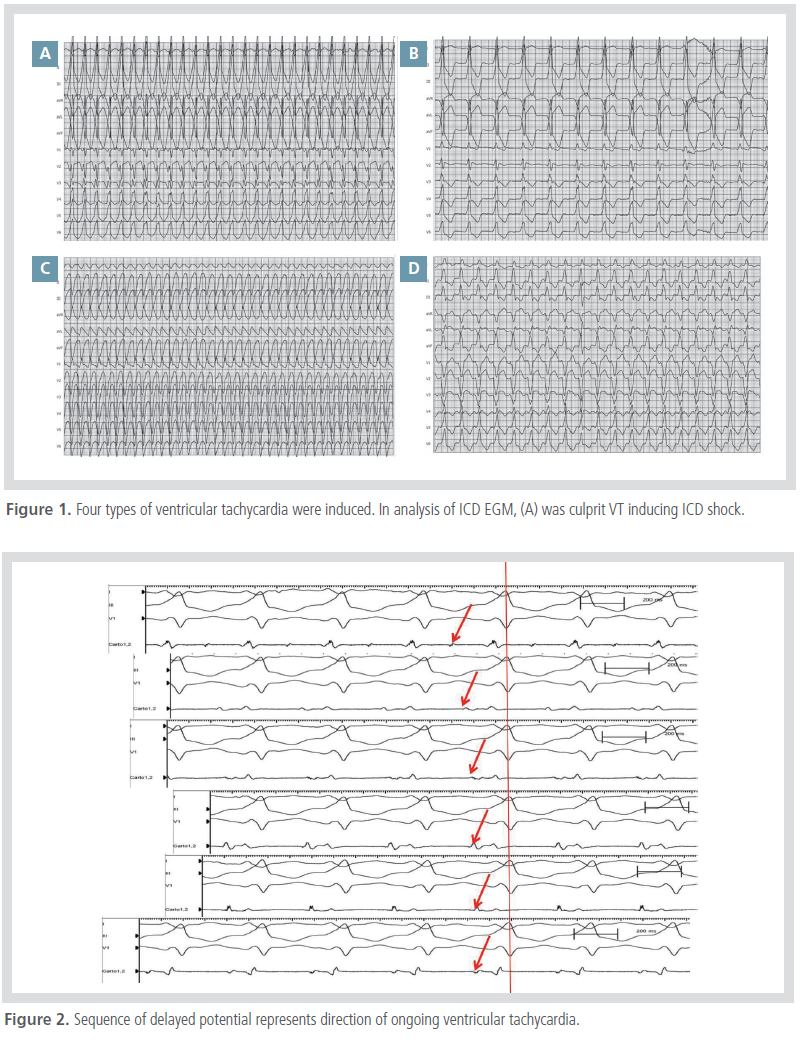
stable and activation mapping was performed. De-layed potentials observed on the scar guided the activation
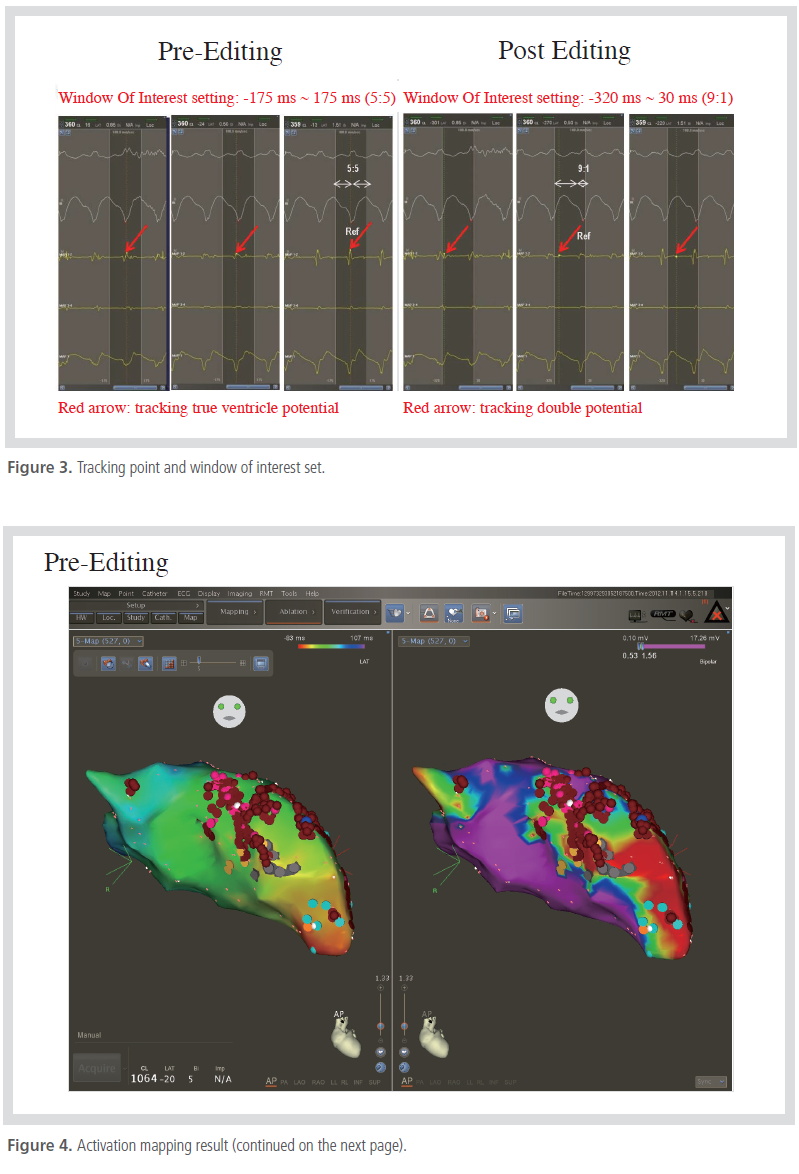
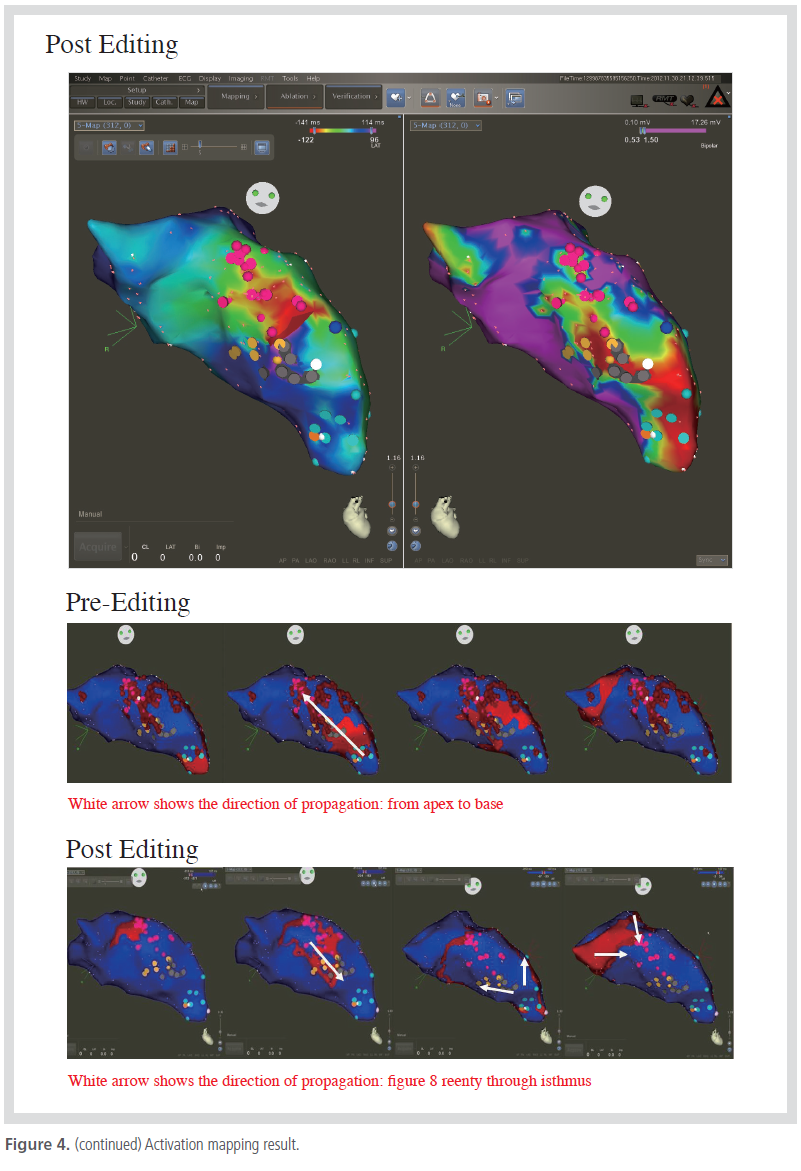
mapping (Figure 2). A comparison of conventional
mapping and our method is shown in Figures 3 and 4. Radiofrequency energies were applied to the
critical isthmus and the scar border. No subsequent
VT was induced.
Discussion
Conventional mapping, which usually consists of
voltage mapping, defining delayed potentials, and
entrainment mapping, requires VT stability and considerable
mapping time.
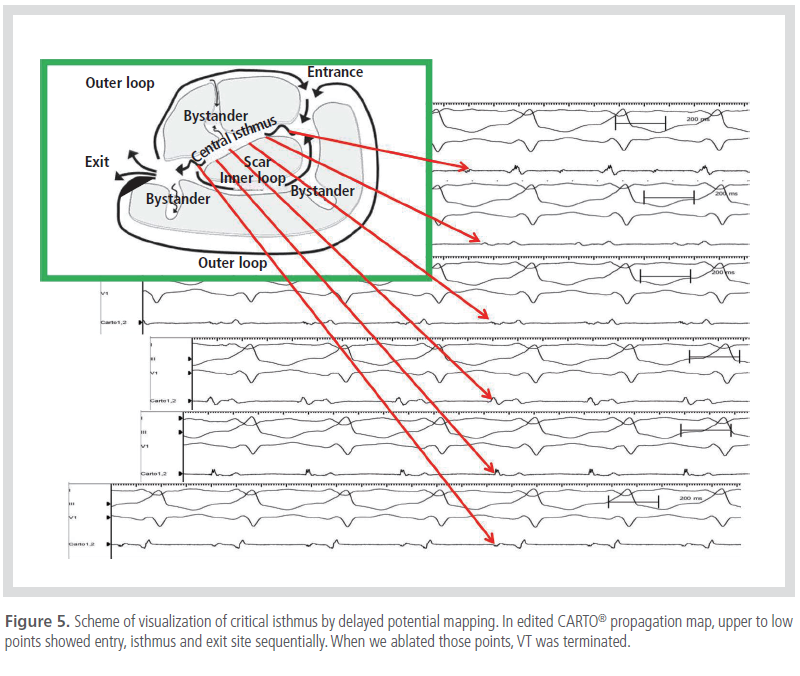
The presence of a delayed potential is referred to
as an “isthmus.”2,3 As such, sequential mapping can
reveal the critical isthmus, the exit of which is located
in the end. Our method simultaneously applied activation
mapping and delayed potential mapping, and
allowed visualization of the critical isthmus and exit site (Figure 5).