AbstractBackground and Objectives:The purpose was to record the time at which biological phenomena stop in different hospital wards and determine regular patterns in times of death, as well as any associated factors.
Subjects and Methods:A total of 6,517 inpatients at the Keimyung University Dongsan Medical Center who died between January 2006 and December 2012 were retrospectively enrolled. A comparative analysis was conducted for the mortality distribution between the intensive care unit (ICU) and general wards (GW).
Results:A total of 3,198 (49%) died in the ICU and 3,319 (51%) in the GW. The ICU showed an increase in mortality over the most recent 3 years. There was no difference in monthly or daily pattern. ICU mortality peaked at 14:00 to 16:00 hours (9.2%) and 20:00 to 22:00 hours (9.1%), and GW mortality peaked at 06:00 to 08:00 hours (9.6%) and 10:00 to 12:00 hours (9.4%), with a significant statistical difference between the two wards (p=0.03). Patients with diseases of the circulatory system died most often in the ICU (28.3%), whereas those with neoplasms had the highest mortality rate in the GW (77.7%) (p<0.01).
IntroductionDue to the rotation of the Earth, organisms inevitably experience 24 hours of day and night. Due to the day-and-night cycle, or rather the regular change between light and dark, organisms on Earth possess endogenous circadian rhythms, which are vital in adapting to changes in one’s environment and sustaining life. Existing research illuminates the effects of changes in the circadian rhythms of animals [1,2].
The suprachiasmatic nucleus (SCN) of the hypothalamus plays the most important role in the maintenance of the mammalian biological clock [1,2]. The SCN receives photosensitive information through the eyes, and its malfunction completely eliminates rhythms associated with regular sleeping and waking patterns. The retina includes not only regular photoreceptors, which participate in visual perception, but also photosensitive ganglion cells. These cells contain photopigments called melanopsin, through which they detect light. The detected light travels via the retinohypothalamic tract to the SCN, thus affecting biological rhythms. Thus, the SCN receives information regarding the length of day and night via the retina and interprets it, after which it signals the pineal gland of the hypothalamus to secrete melatonin. The melatonin secretion level is at its highest during the night and lowest during the day. Thus, melatonin levels may be said to be indicative of the length of night.
However, centuries of civilization and industrialization, and changes in human living patterns and hobbies are speculated to have brought about a change of behavior in daily, weekly, and even yearly activities, and thus caused human circadian rhythms to evolve.
Death occurs when biological regulatory functions that maintain homeostasis stop working. Existing studies suggest that circadian rhythms and biological clocks may affect homeostasis, although results of previous research do not show consensus.
The purpose of the present study was to record the time at which biological phenomena stop in different hospital wards and determine regular patterns in times of death, as well as any associated factors.
Subjects and MethodsThis is a retrospective study in which the subjects consisted of 6,517 inpatients at the Keimyung University Dongsan Medical Center who died between January 2006 and December 2012. A comparative analysis was conducted for the mortality distribution between the intensive care unit (ICU) and general wards (GW) according to year, month, day of week, hour of day, disease entity, and age and sex of the patients. We collected the data on all deaths in the ICU and GW for 7 years and used a cross analysis process, which shows absolute numbers and proportions, for comparison of the wards. The flow of mortality in the ICU and GW was analyzed using annual, monthly, and weekly data. The daily pattern of death was divided by 2-hour periods and the proportion of death by age was divided by decade. The mortality cases in two wards were compared by sex and surgical status, and the format of mortality distribution used International Classification of Disease (ICD) categories.
Statistical analysisThe statistical significance level was set at 5% and all calculations were two-tailed. All categorical variables are expressed as absolute values using the chi-square test as appropriate. The trend line selected was a fifth order polynomial to compare patterns of times of death in the ICU and GW using Excel version 2010. SPSS statistical software version 20.0 (IBM Corp., Released 2011. Armonk, NY) was used for all statistical analyses.
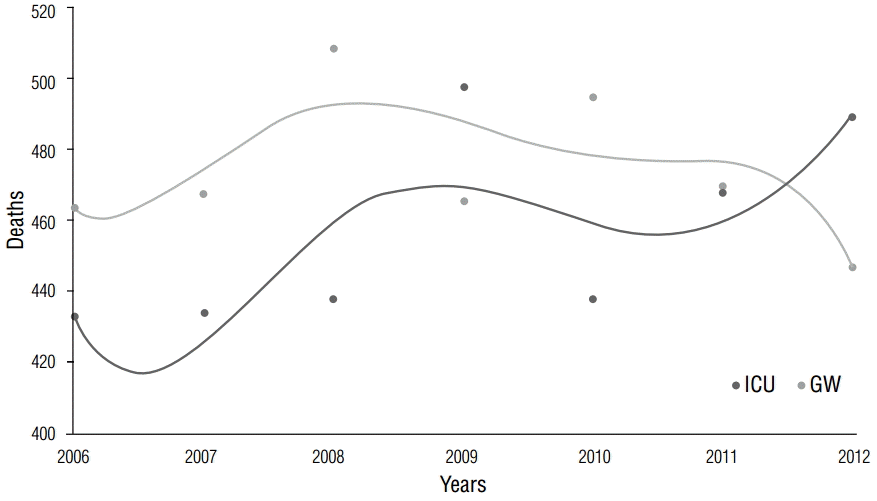
ResultsFrom January 2006 to December 2012, a total of 6,517 patients died, with 3,198 (49%) in the ICU and 3,319 (51%) in the GW. Of the 3,198 (49%) in the ICU, 433 (13.7%) died in 2010, 468 (14.6%) in 2011, and 489 (15.3%) in 2012. Of the 3,319 in the GW, 495 (14.9%) died in 2010, 470 (14.2%) in 2011, and 447 (13.5%) in 2012 (p=0.06; Table 1). Figure 1 shows a decreasing pattern over the most recent 3 years in the GW, with an increasing pattern in the ICU. Mortality distribution by year is presented with a bar graph in Online supplementary figure 1.
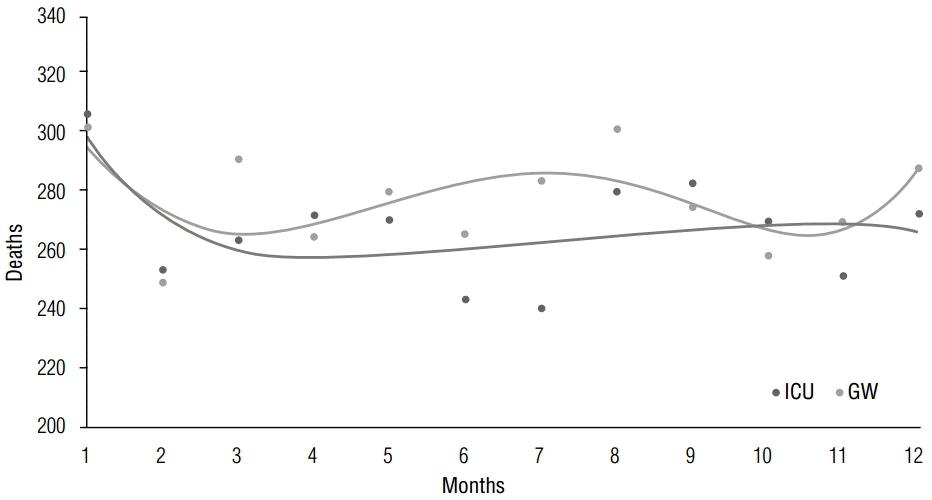
The ICU saw the highest number of deaths in January (9.5%) and September (8.8%), whereas the GW saw the highest number in January (9.1%) and August (9.0%). The ICU saw the highest number of deaths in winter, and the GW in summer, with no statistical difference between the two wards (p-value for season =0.76, p-value for month =0.87; Table 2). Figure 2 shows the trend line of death by months.
When mortality was examined in 1-hour intervals, no statistical difference was found between the two wards (p=0.09). When examined in 2-hour intervals, the ICU peaked in number of deaths at 14:00 to 16:00 hours (9.2%) and 20:00 to 22:00 hours (9.1%), whereas the GW peaked at 06:00 to 08:00 hours (9.6%) and 10:00 to 12:00 hours (9.4%). Examined by 8-hour intervals, the ICU showed a similar number of deaths for morning (from 4 to 12), evening (from 12 to 20) and night (from 20 to 4) hours; the GW showed peak numbers in the morning hours, with a significant statistical difference between the two wards (p-value for 8-hour intervals =0.04, p-value for 2-hour intervals =0.03, Table 3). Mortality distribution by hour of day using a trend line is presented in Figure 3. Online supplementary figure 2 shows a bar graph by 8-hour intervals.
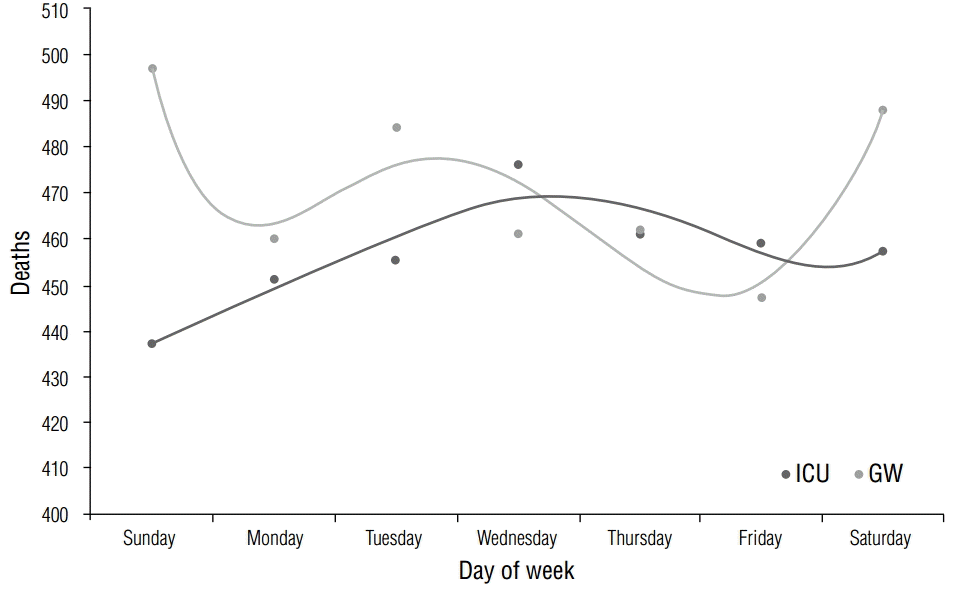
Mortality occurred most often in those in their 60s (ICU, 25.7%; GW, 26.2%) and 70s (ICU, 28.5%; GW, 24.2%), with statistical significance (p-value for age <0.01; Table 4). However, there was no statistical significance for categorical age (p-value for categorical age =0.64, Table 4). Mortality occurred more in men in both groups (ICU, 59.8%; GW, 62.0%), but this effect was not statistically significant (p=0.07; Table 5). The highest mortality rate occurred in the ICU on Wednesdays (14.9%), as opposed to Sundays (14.8%) in the GW. This difference was not statistically significant (p=0.60; Table 6). Figure 4 shows the trend line of deaths.
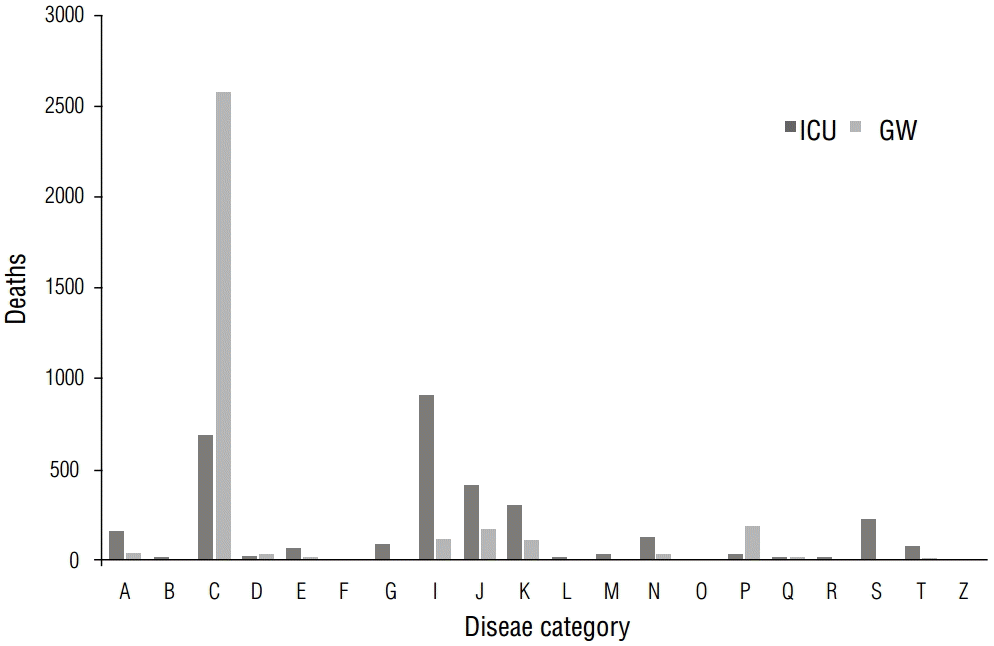
Patients whose diseases fell under ICD group I (diseases of the circulatory system) died most often in the ICU (28.3%), whereas those whose diseases fell under group C (neoplasms) had the highest mortality rate in the GW (77.7%). The difference was statistically significant (p<0.01; Table 7). In both wards, the patients who did not receive surgical treatment had significantly higher mortality than those who did (p<0.01; Table 8).
DiscussionHow does time of death differ between hospital wards?Several interesting facts emerge when mortality rates between 2006 and 2012 in the two hospital wards of the study site are examined. Malignant neoplasms remain the most common cause of death in the GW, in line with many previous findings, whereas diseases of the circulatory system are the most common cause of death in the ICU (Figure 5). Deaths occur most frequently on weekends for those in the GW, as opposed to those in the ICU, in which deaths occur most frequently on weekdays, particularly Wednesdays or Thursdays (Figure 4). The number of deaths in the ICU notably increased on a yearly basis despite advances in medical techniques and information (Figure 1).
According to Rocha et al. [3], malignant neoplasms (42.3%) remain the most common cause of death in the GW, whereas in the ICU, the frequency of septicemia is staggeringly high (64.0%) and the frequency of acute myocardial infarction (AMI) is very low (2.8%). No conclusions have been drawn, but given the high number of deaths due to diseases of the circulatory system in the ICU, the following may be surmised as reasons for the aforementioned trends in mortality: first, a higher ratio of patients have cardiovascular complications compared with those with noncardiovascular complications. Second, patients may often develop multiple organ failure as well as increased diversity of disease as a result of an increased length of stay in the ICU, and thus die owing to inevitable comorbidity with cardiovascular diseases.
Why are ICU deaths increasing?Reasons for the decreasing trend in the number of deaths in the GW after 2008 in contrast with the increasing number in the ICU may include ICU expansion, increased circulatory and respiratory disease as a result of an increase in nosocomial infections and antibiotic-resistant bacteria, and the increased prevalence of infectious diseases in older patients. However, a multifaceted statistical analysis for yearly trends in the cause of death may reveal a more precise reason for this effect.
Why does the distribution of diseases differ between the ICU and GW?As previously mentioned, this is in line with previous research showing that malignant neoplasms are the reason for many deaths in the GW. However, in the ICU, patients have complex causes of death, as they not only have malignant neoplasms but also comorbid circulatory, respiratory, and gastroenterological diseases (Figure 5). Therefore, the results of various studies may differ regarding this topic.
How does mortality rate change in different months?Management of medical personnel affects the mortality rate in a hospital. Another study reported that in-hospital mortality rates are affected by human resource management systems [4]. Moreover, mortality rates increase when resident doctors first begin in-hospital work [5]. At the site of the present study, a monthly analysis showed that the mortality rate in the GW was highest in January or July to September, which were time periods corresponding with January and August staff vacations and redistribution of medical personnel (Figure 2). Meanwhile, no statistical significance (p=0.87) was found between the mortality rate in the months of March to May (ICU, 25.1%; GW, 25.0%) and September to November (ICU, 25.0%; GW, 24.2%), although this appeared to be influenced by the aforementioned management of medical personnel.
How does mortality rate change by different days of the week and time of day?Differences in mortality rates according to time of day or day of the week have been researched most commonly for cardiovascular diseases. A causal relationship between the increase in alphasympathetic tone and sudden cardiac deaths in the mornings was demonstrated [6]. Muller et al. analyzed the relationship between occurrence of death and the time of day among 2,203 patients in Massachusetts hospitals over the course of a year and proposed two reasons why the incidence of sudden cardiac death was highest from 7:00 AM to 11:00 AM while being lowest at night. First, most cases of sudden cardiac death are due to myocardial infarctions caused by platelet aggregation at atherosclerotic lesions of coronary vessels, as a result of the increase of plaque rupture and coronary arterial tone from increased blood pressure in the morning. Second, fatal arrhythmias are likely to occur in the mornings owing to electrical instability arising from an increase in sympathetic nervous system activity in the morning [7-9]. Mundigler et al. analyzed the causal relationship between 6-sulfatoxymelatonin (aMT6s), a metabolite of melatonin, and circadian rhythms, and found that urinary aMT6s excretion was reduced in ICU patients, as opposed to GW patients, who maintained regular aMT6s excretion and thus preserved their circadian rhythms [10]. In the present study, the high mortality rate in the early morning hours (04:00–06:00 AM) in the GW may be corroborated by studies such as those previously mentioned (Figure 3). The reason for the lack of such an effect in the ICU may be that endogenous circadian rhythms are changed as the excretion of melatonin from the pineal gland is affected by the use of various sympathomimetic and sedative drugs, as well as the environment of a hospital ward, in which daytime and nighttime differences are unclear. Hourly melatonin secretion levels were not measured in the present study, but future studies may be able to analyze the mortality rate differences between the ICU and GW by investigating the causal relationship between melatonin secretion and circadian rhythms.
The present study showed that in the GW, high mortality rates occurred on weekends, whereas in the ICU, higher mortality rates occurred on Wednesdays and Thursdays (Figure 4). Although not many studies have analyzed inpatient mortality rates based on the day of the week, outpatients and inpatients may still be considered to possess similar circadian rhythms, under the assumption that circadian rhythms are relatively well preserved in GW patients in comparison with ICU patients. This contradicts other studies that stated that outpatient sudden cardiac deaths occur most frequently on Mondays, as such deaths are cardiovascular events arising from the emotional stresses related to the start of a new week [11]. It may thus be the case that despite being in the GW, inpatients still show changes in circadian rhythms in comparison to outpatients, owing to changes in living patterns arising from hospital admittance, unfamiliar hospital environments, and changes in endogenous hormone secretion that result from the diagnoses and treatments of various diseases. Meanwhile, Lopez et al. reported that a high number of outpatient sudden cardiac arrests occurred on Wednesdays, although the causes have not yet been identified [12]. Witte et al. cited geographical factors for this difference [11]. For instance, et al. studied day-of-week differences in a Chinese population admitted to a coronary care unit for AMI and reported that the incidence rate on Sundays was relatively low and that no peak incidence was seen on Mondays [13]. Furthermore, another study on the incidence rate of AMI among a Chinese population showed that the rate was highest on Saturdays, with statistical significance [14]. In a Japanese population, the weekly and monthly changes in terms of aortic dissection incidence showed no clear difference between the days of the week [15]. Thus, race may also be a factor involved in differences in circadian rhythms.
Neumann et al. analyzed the hourly, weekly, and monthly mortality rates of terminal cancer patients, and found that rates between 08:00 and 10:00 hours and 16:00 and 18:00 hours were higher than those in night hours. The causes may be related to an increase in platelet aggregation, hypercoagulability, and catecholamine secretion, which are all related to sudden cardiac death. Weekly and monthly comparisons between mortality rates showed unclear results [16].
The differences in the time-of-day, day-of-week, and monthly patterns of mortality rates in the ICU and GW may be accounted for by the preservation of circadian rhythms in GW patients, due to their having fewer disturbances in endogenous hormones and physiological changes. Meanwhile, the changes in the circadian rhythms of the ICU patients might have been caused by the differences in disease distribution, hospital room environments, and use of various drugs. However, further research is needed to precisely determine the cause of the aforementioned effects.
ConclusionIn conclusion, the difference between ICU and GW is notable in diurnal variation. This difference is explained by the presence of preserved circadian rhythm. ICU patients might have been influenced by more factors of environmental change than GW patients, such as differences in disease distribution, hospital room environments, and use of various drugs; therefore, ICU patients show different circadian rhythm than GW patients. However, a limitation of our study is that we did not investigate the direct causation of circadian variation and other factors mentioned above.
AcknowledgementsThis work was supported by the R&D Program of the Ministry of Trade, Industry and Energy of Korea (Program of Advanced Technology Development for Future Industry, 10044353). This research was supported by the MOTIE (Ministry of Trade, Industry and Energy), Korea, under the Inter-Economic Regional Cooperation program (R0002625) supervised by the KIAT (Korea Institute for Advancement of Technology).
References1. Zhou XJ, Jiang XH, Yu GD, Yin QZ. Modulation of circadian rhythm of discharges of suprachiasmatic nucleus neurons in rat hypothalamic slices by melatonin. Acta Physiologica Sinica 2000; 52: 215-219.
2. Gillette MU, McArthur AJ. Circadian actions of melatonin at the suprachiasmatic nucleus. Behav Brain Res 1995; 73: 135-139.
3. Rocha AS, Araujo MP, Campos A, Costa Filho R, Mesquita ET, Santos MV. Circadian rhythm of hospital deaths: comparison between intensive care unit and non-intensive care unit. Rev Assoc Med Bras 2011; 57: 529-533.
4. West MA, Guthrie JP, Dawson JF, Borrill CS, Carter M. Reducing patient mortality in hospitals: the role of human resource management. J Organ Behav 2006; 27: 983-1002.
5. Aylin P, Alexandrescu R, Jen MH, Mayer EK, Bottle A. Day of week of procedure and 30 day mortality for elective surgery: retrospective analysis of hospital episode statistics. BMJ 2013; 346: f2424.
6. Panza JA, Epstein SE, Quyyumi AA. Circadian variation in vascular tone and its relation to alpha-sympathetic vasoconstrictor activity. N Engl J Med 1991; 325: 986-990.
7. Muller JE, Ludmer PL, Willich SN, Tofler GH, Aylmer G, Klangos I, Stone PH. Circadian variation in the frequency of sudden cardiac death. Circulation 1987; 75: 131-138.
8. Corbalan R, Verrier R, Lown B. Psychological stress and ventricular arrhythmias during myocardial infarction in the conscious dog. Am J Cardiol 1974; 34: 692-696.
9. Friedman M. The pathogenesis of coronary plaques, thromboses, and hemorrhages: an evaluative review. Circulation 1975; 52: III34-40.
10. Mundigler G, Delle-Karth G, Koreny M, Zehetgruber M, Steindl-Munda P, Marktl W, Marktl W, Ferti L, Siostrzonek P. Impaired circadian rhythm of melatonin secretion in sedated critically ill patients with severe sepsis. Crit Care Med 2002; 30: 536-540.
11. Witte DR, Grobbee DE, Bots ML, Hoes AW. A meta-analysis of excess cardiac mortality on Monday. Eur J Epidemiol 2005; 20: 401-406.
12. Lopez-Messa JB, Alonso-Fernandez JI, Andres-de Llano JM, Garmendia-Leiza JR, Ardura-Fernandez J, de Castro-Rodriguez F, Gil-González JM. Circadian rhythm and time variations in out-hospital sudden cardiac arrest. Med Intensiva 2012; 36: 402-409.
13. Ku CS, Yang CY, Lee WJ, Chiang HT, Liu CP, Lin SL. Absence of a seasonal variation in myocardial infarction onset in a region without temperature extremes. Cardiology 1998; 89: 277-282.
14. Zhou RH, Xi B, Gao HQ, Liu XQ, Li YS, Cao KJ, Lu HM, Zhao CQ, Li XQ. Circadian and septadian variation in the occurrence of acute myocardial infarction in a Chinese population. Jpn Circ J 1998; 62: 190-192.
Figure 1.Mortality distribution by year. The number of deaths in the ICU notably increased on a yearly basis.
GW, general ward; ICU, intensive care unit.

Figure 2.Mortality distribution by month. A monthly analysis showed that mortality rate in the GW was highest in January or July to September.
GW, general ward; ICU, intensive care unit.

Figure 3.Mortality distribution by hour of day. There is a higher mortality rate in the early morning hours (04:00–06:00 AM) in the GW.
GW, general ward; ICU, intensive care unit.

Figure 4. Mortality distribution by day of week. Deaths occur most frequently on weekends for those in the GW, as opposed to those in the ICU, where deaths occur most frequently on weekdays, particularly Wednesdays or Thursdays.
GW, general ward; ICU, intensive care unit.

Figure 5. Mortality distribution by ICD categories. Malignant neoplasms remain the most common cause of death in the GW, in line with many previous reports, whereas diseases of the circulatory system are the most common cause of death in the ICU.
ICD, International Classification of disease; GW, general ward; ICU, intensive care unit.
A, B: Certain infectious and parasitic diseases; C: neoplasms; D: blood and hematopoiesis; E: endocrine and metabolism; F: mental and behavioral disorders; G: nervous system; H: eye, adnexa, ear, and mastoid process; I: circulatory system; J: respiratory system; K: digestive system; L: skin and subcutaneous tissue; M: musculoskeletal system; N: genitourinary system; O: pregnancy and childbirth; P: perinatal period; Q: congenital malformations, deformations, and chromosomal abnormalities; R: miscellaneous; S, T: injury, poisoning, and external causes; U: codes for special purposes; V, Y: external causes of morbidity and mortality; Z: factors influencing health status and contract with health services.

Table 1.Mortality distribution by year Table 2.Mortality distribution by month and season Table 3.Mortality distribution by hour of day Table 4.Mortality distribution by age Table 5.Mortality distribution by sex
Table 6.Morality distribution by day of week Table 7.Mortality distribution by ICD disease categories GW, general ward; ICU, intensive care unit. A, B: Certain infectious and parasitic diseases; C: neoplasms; D: blood and hematopoiesis; E: endocrine and metabolism; F: mental and behavioral disorders; G: nervous system; H: eye, adnexa, ear, and mastoid process; I: circulatory system; J: respiratory system; K: digestive system; L: skin and subcutaneous tissue; M: musculoskeletal system; N: genitourinary system; O: pregnancy and childbirth; P: perinatal period; Q: congenital malformations, deformations, and chromosomal abnormalities; R: miscellaneous; S, T: injury, poisoning, and external causes; U: codes for special purposes; V, Y: external causes of morbidity and mortality; Z: factors influencing health status and contract with health services. |
| |||||||||||||||||||||||||||||||||||||||||||||||||